
Police and Military Simulation Training Market size is set to grow by USD 4,885.06 million from 2022 to 2027; Cost-effective virtual training boosts the market – Technavio
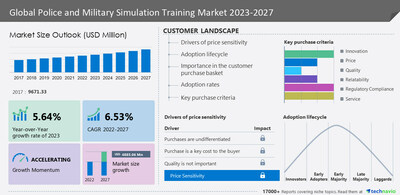
NEW YORK, June 23, 2023 /PRNewswire/ — The global police and military simulation training market size is estimated to grow by USD 4,885.06 million from 2022 to 2027, according to Technavio. The market is estimated to grow at a CAGR of 6.53% during the forecast period. North America is estimated to account for 36% of the market growth. The US defense spending is the highest compared to all other countries. Canada and the US are the major countries in the region with a significant defense budget. Furthermore, the defense ministries in these countries are investing heavily in modernizing their military fleet and associated simulation training equipment. Additionally, some of the vendors who offer police and military training in North America include L3Harris Technologies Inc., Meggitt Plc, and Northrop Grumman Corp. Hence, such factors drive the regional market growth during the forecast period. For more insights on the historic period (2017 to 2021) and forecast market size (2023 to 2027) – Request a sample report
What’s New?

- Special coverage on the Russia–Ukraine war; global inflation; recovery analysis from COVID-19; supply chain disruptions, global trade tensions; and risk of recession
- Global competitiveness and key competitor positions
- Market presence across multiple geographical footprints – Strong/Active/Niche/Trivial – buy the report!
Police And Military Simulation Training Market – Segmentation Assessment
Segment Overview
This report extensively covers market segmentation by product (flight, combat, and maritime), application (air, naval, and ground), and geography (APAC, North America, Europe, Middle East and Africa, and South America).
- The market share growth by the flight segment is significant during the forecast period. Flight simulators are used for training pilots by creating a virtual environment for various aspects of a flight. They enhance the skills of pilots. Currently, several major military aircraft deals are under process, which will drive the growth of the flight segment. The governments of many countries are acquiring new flight simulators to train their pilots. These factors are expected to drive the growth of the flight segment during the forecast period.
Insights on the market contribution of various segments, including country and region wise historic data (2017 to 2021), and forecast market size (2023 to 2027) – Download a Sample Report
Police And Military Simulation Training Market – Market Dynamics
Key factor driving market growth
Cost-effective virtual training is one of the primary factors leading the global police and military simulation training market growth. The growth is attributed to virtual training as it reduces the supplementary cost of resources including the costs associated with fuel for military platforms, procurement of training ammunition, and operational costs.
Furthermore, in real-time training, supplementary cost of resources includes costs associated with fuel for military platforms and procurement of training ammunition and operational costs. Hence, such factors boost the market growth during the forecast period,
Leading trends influencing the market
Education via STE is a major trend boosting market growth during the forecast period. Most present-day simulators mimic one combat vehicle or a single weapon at any point in time but STE provides a solution to this problem by bringing together different kinds of platforms for combined-arms training.
Furthermore, STE works as a single system to emphasize the cognitive, physical, and social elements and enhances live training via integrating augmented reality using cloud technologies and geospatial databases. Hence, such trends fuel the market growth during the forecast period.
Major challenges hindering the market growth
High investments required for simulation systems challenge the growth of the market during the forecast period. With the advent of COTS and strict requirements related to the size, weight, and power (SWaP) of components and systems, the police and military simulators and training devices market has witnessed a sizeable cost reduction.
Moreover, the simulator units are expensive, costing a few million dollars, especially in the case of military simulation training devices, mainly because these simulator systems are highly advanced and expensive in comparison to their civil counterparts. Hence, such challenges impede market growth during the forecast period.
Insights on Market Drivers, trends, & Challenges, historic period(2017 to 2021), and forecast period(2023 to 2027)- Request a sample report!
What are the key data covered in this Police and Military Simulation Training Market report?
- CAGR of the market during the forecast period
- Detailed information on factors that will drive the growth of the police and military simulation training market between 2023 and 2027
- Precise estimation of the size of the police and military simulation training market and its contribution to the market with a focus on the parent market
- Accurate predictions about upcoming trends and changes in consumer behavior
- Growth of the police and military simulation training market across North America, APAC, Europe, Middle East and Africa, and South America
- A thorough analysis of the market’s competitive landscape and detailed information about vendors
- Comprehensive analysis of factors that will challenge the growth of police and military simulation training market vendors
Gain instant access to 17,000+ market research reports.
Technavio’s SUBSCRIPTION platform
Related Reports:
The Police and Law Enforcement Equipment Market is estimated to grow at a CAGR 6.4% and the market size increase by USD 1,271.94 million between 2022 and 2027. The Product Segmentation by lethal and non-lethal weapons, surveillance systems, communication systems, and others.The geography segment include North America, Europe, APAC, South America, and Middle East and Africa.The report offers market size and forecasts for all the above segments in value (USD billion). The market trend is centered around the integration of electronic components, particularly in personnel protective suits.
The Military Mobile Computing Systems Market size is estimated to grow at a CAGR of 7.93% between 2022 and 2027, and the size of the market is forecast to increase by USD 1,387.07 million. This military mobile computing systems market report extensively covers market segmentation by component (products and services), device (radio, smartphones, tablets, and PCs and laptops), and geography (North America, Europe, APAC, South America, and Middle East and Africa). A greater focus on ISR operations is the key factor driving the global military mobile computing systems market growth.
|
Police And Military Simulation Training Market Scope |
|
|
Report Coverage |
Details |
|
Base year |
2022 |
|
Historic period |
2017-2021 |
|
Forecast period |
2023-2027 |
|
Growth momentum & CAGR |
Accelerate at a CAGR of 6.53% |
|
Market growth 2023-2027 |
USD 4,885.06 million |
|
Market structure |
Fragmented |
|
YoY growth 2022-2023 (%) |
5.64 |
|
Regional analysis |
North America, APAC, Europe, Middle East and Africa, and South America |
|
Performing market contribution |
North America at 36% |
|
Key countries |
US, Canada, China, UK, and Germany |
|
Competitive landscape |
Leading Vendors, Market Positioning of Vendors, Competitive Strategies, and Industry Risks |
|
Key companies profiled |
Arotech Corp., Ascent Flight Training Holdings, BAE Systems Plc, Berkshire Hathaway Inc., Bohemia Interactive Simulations ks, Cubic Corp., General Dynamics Mission Systems Inc., H SIM, Indra Sistemas SA, Israel Aerospace Industries Ltd., Kratos Defense and Security Solutions Inc, L3Harris Technologies Inc., Lockheed Martin Corp., Meggitt Plc, Northrop Grumman Corp., Raytheon Technologies Corp., Rheinmetall AG, Saab AB, and Virtra Inc. |
|
Market dynamics |
Parent market analysis, Market growth inducers and obstacles, Fast-growing and slow-growing segment analysis, COVID-19 impact and recovery analysis and future consumer dynamics, Market condition analysis for forecast period. |
|
Customization purview |
If our report has not included the data that you are looking for, you can reach out to our analysts and get segments customized. |
Table of Contents
1 Executive Summary
- 1.1 Market overview
- Exhibit 01: Executive Summary – Chart on Market Overview
- Exhibit 02: Executive Summary – Data Table on Market Overview
- Exhibit 03: Executive Summary – Chart on Global Market Characteristics
- Exhibit 04: Executive Summary – Chart on Market by Geography
- Exhibit 05: Executive Summary – Chart on Market Segmentation by Product
- Exhibit 06: Executive Summary – Chart on Market Segmentation by Application
- Exhibit 07: Executive Summary – Chart on Incremental Growth
- Exhibit 08: Executive Summary – Data Table on Incremental Growth
- Exhibit 09: Executive Summary – Chart on Vendor Market Positioning
2 Market Landscape
- 2.1 Market ecosystem
- Exhibit 10: Parent market
- Exhibit 11: Market Characteristics
3 Market Sizing
- 3.1 Market definition
- Exhibit 12: Offerings of vendors included in the market definition
- 3.2 Market segment analysis
- Exhibit 13: Market segments
- 3.3 Market size 2022
- 3.4 Market outlook: Forecast for 2022-2027
- Exhibit 14: Chart on Global – Market size and forecast 2022-2027 ($ million)
- Exhibit 15: Data Table on Global – Market size and forecast 2022-2027 ($ million)
- Exhibit 16: Chart on Global Market: Year-over-year growth 2022-2027 (%)
- Exhibit 17: Data Table on Global Market: Year-over-year growth 2022-2027 (%)
4 Historic Market Size
- 4.1 Global police and military simulation training market 2017 – 2021
- Exhibit 18: Historic Market Size – Data Table on Global police and military simulation training market 2017 – 2021 ($ million)
- 4.2 Product Segment Analysis 2017 – 2021
- Exhibit 19: Historic Market Size – Product Segment 2017 – 2021 ($ million)
- 4.3 Application Segment Analysis 2017 – 2021
- Exhibit 20: Historic Market Size – Application Segment 2017 – 2021 ($ million)
- 4.4 Geography Segment Analysis 2017 – 2021
- Exhibit 21: Historic Market Size – Geography Segment 2017 – 2021 ($ million)
- 4.5 Country Segment Analysis 2017 – 2021
- Exhibit 22: Historic Market Size – Country Segment 2017 – 2021 ($ million)
5 Five Forces Analysis
- 5.1 Five forces summary
- Exhibit 23: Five forces analysis – Comparison between 2022 and 2027
- 5.2 Bargaining power of buyers
- Exhibit 24: Chart on Bargaining power of buyers – Impact of key factors 2022 and 2027
- 5.3 Bargaining power of suppliers
- Exhibit 25: Bargaining power of suppliers – Impact of key factors in 2022 and 2027
- 5.4 Threat of new entrants
- Exhibit 26: Threat of new entrants – Impact of key factors in 2022 and 2027
- 5.5 Threat of substitutes
- Exhibit 27: Threat of substitutes – Impact of key factors in 2022 and 2027
- 5.6 Threat of rivalry
- Exhibit 28: Threat of rivalry – Impact of key factors in 2022 and 2027
- 5.7 Market condition
- Exhibit 29: Chart on Market condition – Five forces 2022 and 2027
6 Market Segmentation by Product
- 6.1 Market segments
- Exhibit 30: Chart on Product – Market share 2022-2027 (%)
- Exhibit 31: Data Table on Product – Market share 2022-2027 (%)
- 6.2 Comparison by Product
- Exhibit 32: Chart on Comparison by Product
- Exhibit 33: Data Table on Comparison by Product
- 6.3 Flight – Market size and forecast 2022-2027
- Exhibit 34: Chart on Flight – Market size and forecast 2022-2027 ($ million)
- Exhibit 35: Data Table on Flight – Market size and forecast 2022-2027 ($ million)
- Exhibit 36: Chart on Flight – Year-over-year growth 2022-2027 (%)
- Exhibit 37: Data Table on Flight – Year-over-year growth 2022-2027 (%)
- 6.4 Combat – Market size and forecast 2022-2027
- Exhibit 38: Chart on Combat – Market size and forecast 2022-2027 ($ million)
- Exhibit 39: Data Table on Combat – Market size and forecast 2022-2027 ($ million)
- Exhibit 40: Chart on Combat – Year-over-year growth 2022-2027 (%)
- Exhibit 41: Data Table on Combat – Year-over-year growth 2022-2027 (%)
- 6.5 Maritime – Market size and forecast 2022-2027
- Exhibit 42: Chart on Maritime – Market size and forecast 2022-2027 ($ million)
- Exhibit 43: Data Table on Maritime – Market size and forecast 2022-2027 ($ million)
- Exhibit 44: Chart on Maritime – Year-over-year growth 2022-2027 (%)
- Exhibit 45: Data Table on Maritime – Year-over-year growth 2022-2027 (%)
- 6.6 Market opportunity by Product
- Exhibit 46: Market opportunity by Product ($ million)
7 Market Segmentation by Application
- 7.1 Market segments
- Exhibit 47: Chart on Application – Market share 2022-2027 (%)
- Exhibit 48: Data Table on Application – Market share 2022-2027 (%)
- 7.2 Comparison by Application
- Exhibit 49: Chart on Comparison by Application
- Exhibit 50: Data Table on Comparison by Application
- 7.3 Air – Market size and forecast 2022-2027
- Exhibit 51: Chart on Air – Market size and forecast 2022-2027 ($ million)
- Exhibit 52: Data Table on Air – Market size and forecast 2022-2027 ($ million)
- Exhibit 53: Chart on Air – Year-over-year growth 2022-2027 (%)
- Exhibit 54: Data Table on Air – Year-over-year growth 2022-2027 (%)
- 7.4 Naval – Market size and forecast 2022-2027
- Exhibit 55: Chart on Naval – Market size and forecast 2022-2027 ($ million)
- Exhibit 56: Data Table on Naval – Market size and forecast 2022-2027 ($ million)
- Exhibit 57: Chart on Naval – Year-over-year growth 2022-2027 (%)
- Exhibit 58: Data Table on Naval – Year-over-year growth 2022-2027 (%)
- 7.5 Ground – Market size and forecast 2022-2027
- Exhibit 59: Chart on Ground – Market size and forecast 2022-2027 ($ million)
- Exhibit 60: Data Table on Ground – Market size and forecast 2022-2027 ($ million)
- Exhibit 61: Chart on Ground – Year-over-year growth 2022-2027 (%)
- Exhibit 62: Data Table on Ground – Year-over-year growth 2022-2027 (%)
- 7.6 Market opportunity by Application
- Exhibit 63: Market opportunity by Application ($ million)
8 Customer Landscape
- 8.1 Customer landscape overview
- Exhibit 64: Analysis of price sensitivity, lifecycle, customer purchase basket, adoption rates, and purchase criteria
9 Geographic Landscape
- 9.1 Geographic segmentation
- Exhibit 65: Chart on Market share by geography 2022-2027 (%)
- Exhibit 66: Data Table on Market share by geography 2022-2027 (%)
- 9.2 Geographic comparison
- Exhibit 67: Chart on Geographic comparison
- Exhibit 68: Data Table on Geographic comparison
- 9.3 North America – Market size and forecast 2022-2027
- Exhibit 69: Chart on North America – Market size and forecast 2022-2027 ($ million)
- Exhibit 70: Data Table on North America – Market size and forecast 2022-2027 ($ million)
- Exhibit 71: Chart on North America – Year-over-year growth 2022-2027 (%)
- Exhibit 72: Data Table on North America – Year-over-year growth 2022-2027 (%)
- 9.4 APAC – Market size and forecast 2022-2027
- Exhibit 73: Chart on APAC – Market size and forecast 2022-2027 ($ million)
- Exhibit 74: Data Table on APAC – Market size and forecast 2022-2027 ($ million)
- Exhibit 75: Chart on APAC – Year-over-year growth 2022-2027 (%)
- Exhibit 76: Data Table on APAC – Year-over-year growth 2022-2027 (%)
- 9.5 Europe – Market size and forecast 2022-2027
- Exhibit 77: Chart on Europe – Market size and forecast 2022-2027 ($ million)
- Exhibit 78: Data Table on Europe – Market size and forecast 2022-2027 ($ million)
- Exhibit 79: Chart on Europe – Year-over-year growth 2022-2027 (%)
- Exhibit 80: Data Table on Europe – Year-over-year growth 2022-2027 (%)
- 9.6 Middle East and Africa – Market size and forecast 2022-2027
- Exhibit 81: Chart on Middle East and Africa – Market size and forecast 2022-2027 ($ million)
- Exhibit 82: Data Table on Middle East and Africa – Market size and forecast 2022-2027 ($ million)
- Exhibit 83: Chart on Middle East and Africa – Year-over-year growth 2022-2027 (%)
- Exhibit 84: Data Table on Middle East and Africa – Year-over-year growth 2022-2027 (%)
- 9.7 South America – Market size and forecast 2022-2027
- Exhibit 85: Chart on South America – Market size and forecast 2022-2027 ($ million)
- Exhibit 86: Data Table on South America – Market size and forecast 2022-2027 ($ million)
- Exhibit 87: Chart on South America – Year-over-year growth 2022-2027 (%)
- Exhibit 88: Data Table on South America – Year-over-year growth 2022-2027 (%)
- 9.8 US – Market size and forecast 2022-2027
- Exhibit 89: Chart on US – Market size and forecast 2022-2027 ($ million)
- Exhibit 90: Data Table on US – Market size and forecast 2022-2027 ($ million)
- Exhibit 91: Chart on US – Year-over-year growth 2022-2027 (%)
- Exhibit 92: Data Table on US – Year-over-year growth 2022-2027 (%)
- 9.9 UK – Market size and forecast 2022-2027
- Exhibit 93: Chart on UK – Market size and forecast 2022-2027 ($ million)
- Exhibit 94: Data Table on UK – Market size and forecast 2022-2027 ($ million)
- Exhibit 95: Chart on UK – Year-over-year growth 2022-2027 (%)
- Exhibit 96: Data Table on UK – Year-over-year growth 2022-2027 (%)
- 9.10 China – Market size and forecast 2022-2027
- Exhibit 97: Chart on China – Market size and forecast 2022-2027 ($ million)
- Exhibit 98: Data Table on China – Market size and forecast 2022-2027 ($ million)
- Exhibit 99: Chart on China – Year-over-year growth 2022-2027 (%)
- Exhibit 100: Data Table on China – Year-over-year growth 2022-2027 (%)
- 9.11 Germany – Market size and forecast 2022-2027
- Exhibit 101: Chart on Germany – Market size and forecast 2022-2027 ($ million)
- Exhibit 102: Data Table on Germany – Market size and forecast 2022-2027 ($ million)
- Exhibit 103: Chart on Germany – Year-over-year growth 2022-2027 (%)
- Exhibit 104: Data Table on Germany – Year-over-year growth 2022-2027 (%)
- 9.12 Canada – Market size and forecast 2022-2027
- Exhibit 105: Chart on Canada – Market size and forecast 2022-2027 ($ million)
- Exhibit 106: Data Table on Canada – Market size and forecast 2022-2027 ($ million)
- Exhibit 107: Chart on Canada – Year-over-year growth 2022-2027 (%)
- Exhibit 108: Data Table on Canada – Year-over-year growth 2022-2027 (%)
- 9.13 Market opportunity by geography
- Exhibit 109: Market opportunity by geography ($ million)
10 Drivers, Challenges, and Trends
- 10.1 Market drivers
- 10.2 Market challenges
- 10.3 Impact of drivers and challenges
- Exhibit 110: Impact of drivers and challenges in 2022 and 2027
- 10.4 Market trends
11 Vendor Landscape
- 11.1 Overview
- 11.2 Vendor landscape
- Exhibit 111: Overview on Criticality of inputs and Factors of differentiation
- 11.3 Landscape disruption
- Exhibit 112: Overview on factors of disruption
- 11.4 Industry risks
- Exhibit 113: Impact of key risks on business
12 Vendor Analysis
- 12.1 Vendors covered
- Exhibit 114: Vendors covered
- 12.2 Market positioning of vendors
- Exhibit 115: Matrix on vendor position and classification
- 12.3 Arotech Corp.
- Exhibit 116: Arotech Corp. – Overview
- Exhibit 117: Arotech Corp. – Product / Service
- Exhibit 118: Arotech Corp. – Key offerings
- 12.4 Ascent Flight Training Holdings
- Exhibit 119: Ascent Flight Training Holdings – Overview
- Exhibit 120: Ascent Flight Training Holdings – Product / Service
- Exhibit 121: Ascent Flight Training Holdings – Key offerings
- 12.5 BAE Systems Plc
- Exhibit 122: BAE Systems Plc – Overview
- Exhibit 123: BAE Systems Plc – Business segments
- Exhibit 124: BAE Systems Plc – Key offerings
- Exhibit 125: BAE Systems Plc – Segment focus
- 12.6 Berkshire Hathaway Inc.
- Exhibit 126: Berkshire Hathaway Inc. – Overview
- Exhibit 127: Berkshire Hathaway Inc. – Business segments
- Exhibit 128: Berkshire Hathaway Inc. – Key news
- Exhibit 129: Berkshire Hathaway Inc. – Key offerings
- Exhibit 130: Berkshire Hathaway Inc. – Segment focus
- 12.7 Cubic Corp.
- Exhibit 131: Cubic Corp. – Overview
- Exhibit 132: Cubic Corp. – Business segments
- Exhibit 133: Cubic Corp. – Key offerings
- Exhibit 134: Cubic Corp. – Segment focus
- 12.8 General Dynamics Mission Systems Inc.
- Exhibit 135: General Dynamics Mission Systems Inc. – Overview
- Exhibit 136: General Dynamics Mission Systems Inc. – Business segments
- Exhibit 137: General Dynamics Mission Systems Inc. – Key news
- Exhibit 138: General Dynamics Mission Systems Inc. – Key offerings
- Exhibit 139: General Dynamics Mission Systems Inc. – Segment focus
- 12.9 H SIM
- Exhibit 140: H SIM – Overview
- Exhibit 141: H SIM – Product / Service
- Exhibit 142: H SIM – Key offerings
- 12.10 Indra Sistemas SA
- Exhibit 143: Indra Sistemas SA – Overview
- Exhibit 144: Indra Sistemas SA – Business segments
- Exhibit 145: Indra Sistemas SA – Key offerings
- Exhibit 146: Indra Sistemas SA – Segment focus
- 12.11 Israel Aerospace Industries Ltd.
- Exhibit 147: Israel Aerospace Industries Ltd. – Overview
- Exhibit 148: Israel Aerospace Industries Ltd. – Product / Service
- Exhibit 149: Israel Aerospace Industries Ltd. – Key news
- Exhibit 150: Israel Aerospace Industries Ltd. – Key offerings
- 12.12 Kratos Defense and Security Solutions Inc
- Exhibit 151: Kratos Defense and Security Solutions Inc – Overview
- Exhibit 152: Kratos Defense and Security Solutions Inc – Business segments
- Exhibit 153: Kratos Defense and Security Solutions Inc – Key offerings
- Exhibit 154: Kratos Defense and Security Solutions Inc – Segment focus
- 12.13 L3Harris Technologies Inc.
- Exhibit 155: L3Harris Technologies Inc. – Overview
- Exhibit 156: L3Harris Technologies Inc. – Business segments
- Exhibit 157: L3Harris Technologies Inc. – Key news
- Exhibit 158: L3Harris Technologies Inc. – Key offerings
- Exhibit 159: L3Harris Technologies Inc. – Segment focus
- 12.14 Lockheed Martin Corp.
- Exhibit 160: Lockheed Martin Corp. – Overview
- Exhibit 161: Lockheed Martin Corp. – Business segments
- Exhibit 162: Lockheed Martin Corp. – Key news
- Exhibit 163: Lockheed Martin Corp. – Key offerings
- Exhibit 164: Lockheed Martin Corp. – Segment focus
- 12.15 Meggitt Plc
- Exhibit 165: Meggitt Plc – Overview
- Exhibit 166: Meggitt Plc – Business segments
- Exhibit 167: Meggitt Plc – Key news
- Exhibit 168: Meggitt Plc – Key offerings
- Exhibit 169: Meggitt Plc – Segment focus
- 12.16 Northrop Grumman Corp.
- Exhibit 170: Northrop Grumman Corp. – Overview
- Exhibit 171: Northrop Grumman Corp. – Business segments
- Exhibit 172: Northrop Grumman Corp. – Key news
- Exhibit 173: Northrop Grumman Corp. – Key offerings
- Exhibit 174: Northrop Grumman Corp. – Segment focus
- 12.17 Raytheon Technologies Corp.
- Exhibit 175: Raytheon Technologies Corp. – Overview
- Exhibit 176: Raytheon Technologies Corp. – Business segments
- Exhibit 177: Raytheon Technologies Corp. – Key offerings
- Exhibit 178: Raytheon Technologies Corp. – Segment focus
13 Appendix
- 13.1 Scope of the report
- 13.2 Inclusions and exclusions checklist
- Exhibit 179: Inclusions checklist
- Exhibit 180: Exclusions checklist
- 13.3 Currency conversion rates for US$
- Exhibit 181: Currency conversion rates for US$
- 13.4 Research methodology
- Exhibit 182: Research methodology
- Exhibit 183: Validation techniques employed for market sizing
- Exhibit 184: Information sources
- 13.5 List of abbreviations
- Exhibit 185: List of abbreviations
About Us
Technavio is a leading global technology research and advisory company. Their research and analysis focus on emerging market trends and provide actionable insights to help businesses identify market opportunities and develop effective strategies to optimize their market positions. With over 500 specialized analysts, Technavio’s report library consists of more than 17,000 reports and counting, covering 800 technologies, spanning 50 countries. Their client base consists of enterprises of all sizes, including more than 100 Fortune 500 companies. This growing client base relies on Technavio’s comprehensive coverage, extensive research, and actionable market insights to identify opportunities in existing and potential markets and assess their competitive positions within changing market scenarios.
Contact
Technavio Research
Jesse Maida
Media & Marketing Executive
US: +1 844 364 1100
UK: +44 203 893 3200
Email: media@technavio.com
Website: www.technavio.com
![]()
![]() View original content to download multimedia:https://www.prnewswire.com/news-releases/police-and-military-simulation-training-market-size-is-set-to-grow-by-usd-4-885-06-million-from-2022-to-2027-cost-effective-virtual-training-boosts-the-market—technavio-301858376.html
View original content to download multimedia:https://www.prnewswire.com/news-releases/police-and-military-simulation-training-market-size-is-set-to-grow-by-usd-4-885-06-million-from-2022-to-2027-cost-effective-virtual-training-boosts-the-market—technavio-301858376.html
SOURCE Technavio
