
Spotify Technology S.A. Announces Financial Results for Fourth Quarter 2018
NEW YORK–(BUSINESS WIRE)–Spotify Technology S.A. (NYSE:SPOT) today reported financial results for
the fourth fiscal quarter of 2018 ending December 31, 2018.
Dear Shareholders,

![]()
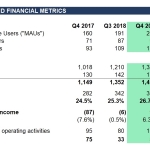
Results for Q4 2018 outperformed our expectations and, for the first
time in company history, Operating Income, Net Income, and Free Cash
Flow were all positive.

MONTHLY ACTIVE USERS
MAUs grew 29% Y/Y to 207 million, outperforming the high end of our
199-206 million MAU guidance range. This outperformance was broad based,
with growth in most markets exceeding our expectations, primarily as a
result of improved retention relative to our forecast. Latin America and
other emerging regions continue to see especially strong growth.
During Q4 our footprint expanded to 78 countries from 65 as we launched
our service across 13 countries in the Middle East and North Africa in
mid-November. Performance to date has exceeded our initial expectations,
and we hope to build on this momentum in 2019.
We also reached an important milestone as users listened to more than 15
billion hours of content on the platform during Q4. Importantly,
engagement grew across both the Ad-Supported and Premium tiers.
PREMIUM SUBSCRIBERS
Premium Subscribers reached 96 million, up 36% Y/Y, hitting the high end
of our guidance range of 93-96 million. Outperformance was largely
attributable to better than expected intake from our Google Home
promotion and annual Holiday campaign.
Our Google Home promotion marked the first ever hardware bundle offering
in company history. For a limited time during Q4, master account holders
of our Family Plan in the US were able to claim a Google Home Mini
speaker free of charge. We believe home voice speakers are a critical
area of growth, particularly for music and audio content, and we are
evaluating a number of ways to explore and refine our offering in this
arena.
We ran our annual Holiday conversion promotion during Q4, which
outperformed our expectations for new subscriber additions. Over the
course of 6 weeks, almost 7 million subscribers were added through this
campaign, including a single day record of almost 500,000. In December,
we also launched our annual Wrapped Holiday brand campaign where
existing users were able to explore stats about their listening habits
throughout the year. The campaign saw the highest traffic ever to the
Wrapped site spotifywrapped.com,
with 28 million users visiting the site in just one week (up from 20
million last year total.) The Holiday campaign became the #1 trending
topic on Twitter globally and generated over 5 billion streams of the
“Your Top Songs 2018” playlist, now the fastest growing personalized
playlist in Spotify history.
Growth in both Family and Student plans was healthy, and churn continues
to trend down, improving more than 30 bps Y/Y in Q4. We expect to see a
sequential increase in churn in Q1 owing to the rapid campaign growth in
Q4. Despite these seasonal effects, we expect churn to continue to
decline over the course of 2019.
FINANCIAL METRICS
Revenue
Total Q4 revenue was €1,495 million, up 30% Y/Y. Foreign exchange rates
negatively impacted our Premium segment and positively impacted our
Ad-Supported segment yielding minimal impact on our consolidated results.
Premium revenue was €1,320 million in Q4, up 30% Y/Y. Average revenue
per user (“ARPU”) was €4.89 in Q4. This represents a 7% Y/Y decline (6%
excluding the impact from foreign exchange rates). The downward pressure
on ARPU continues to be driven by product mix (Family Plan and Student
Plan as a percentage of the total base), and is increasingly driven by
market mix as growth in our relatively lower ARPU markets is outpacing
geographies with higher ARPU. Despite the decline in ARPU, Lifetime
Value per Subscriber (“LTV”) has remained constant Y/Y as improvements
in churn offset the decline in ARPU.
Ad-Supported revenue of €175 million re-accelerated its Y/Y growth in Q4
to 34% (31% excluding the impact from foreign exchange rates) as
compared to 30% Y/Y growth in Q3. Revenue from North America continued
to accelerate, growing 41% Y/Y (37% excluding movements in F/X). Both
Audio and Video format ads grew more than 40% in Q4. While Audio remains
our largest contributor to Total Revenue, the recent implementation of
cost-per-completed-view pricing across a larger amount of our video
inventory offers a runway to accelerated future growth. The changes we
made in late Q2 to our data policies to improve our ability to measure
performance and show advertising effectiveness continued to drive strong
performance in Q4 with revenue growth in third party measurement
products of 77% Y/Y.
Growth in our Programmatic and Self-Serve (Ad Studio) channels continue
to outpace the growth of Direct. Combined they grew ~60% Y/Y and
together account for ~25% of our total Ad Sales revenue. More than 2,000
advertisers used our Ad Studio platform in Q4 to run campaigns. We
continue to expect these automated channels to become an increasingly
significant portion of our Ad-Supported revenue, and for operating
margins to expand as a result.
Gross Margin
Gross Margin was 26.7% in Q4, above the high end of our guidance range
of 24-26%, and up 220 bps Y/Y. Several one-time items contributed to the
growth in gross margin, the largest of which was a license fee
adjustment relating to prior periods that was booked in Q4. Excluding
non-recurring items in Q4, our GM would have been 25.8%. This 25.8%
includes the impact from the Google Home Mini offer.
Premium Gross Margin was 27.3% in Q4, up from 26.1% in Q3, and up 200
bps Y/Y. Ad-Supported Gross Margin was 22.1% in Q4, up from 18.6% in Q3,
and up 350 bps Y/Y.
As a reminder, Ad-Supported Gross Margins are relatively strong in our
top five markets and relatively weak in our 73 other markets, including
newly launched markets. As these markets grow, we believe margins should
too. Our Ad-Supported Gross Margin does not show the same seasonality as
our Premium Gross Margin, and has tended to increase quarterly during
the calendar year.
Spotify for Artists
Today, more than 300,000 creators and their teams use our Artist
platform on a monthly basis, and we added several more features to our
creator marketplace tool in Q4. On October 3, 2018 we launched Spotify
for Podcasters, a platform where podcast creators who host their
podcasts elsewhere can make their shows available to Spotify users by
providing us with their podcast feed. Users have access to episode
performance, daily stats on listener demographics, location, engagement,
and more—great tools to help learn more about and grow audiences. More
than 10,000 podcasters are using this tool on a monthly basis to gain
deeper insight into their audience. Today, there are more than 185,000
podcast titles available on our platform, and consumption continues to
grow rapidly. In Q4 we had 14 titles exclusive to Spotify including the
2nd season of Crimetown, The Rewind with Guy Raz, and the Dissect Mini
Series hosted by Lauryn Hill.
On November 8, 2018 we launched Spotify Publishing Analytics in Beta,
the first analytics tool from a music streaming service built
specifically for publishers. The tool gives publishers daily streaming
statistics for the works and recordings they have identified, including
playlist performance, as well as the ability to view data for each of
the songwriters on their roster. More than 1,000 users from music
publishers around the world requested access to the beta version of the
site within the first two weeks of launch, and we plan to expand the
offering throughout 2019.
Operating Expenses / Income (Loss)
Operating expenses of €305 million in Q4 were down 17% Y/Y, resulting in
an Operating Profit of €94 million. This is Spotify’s first ever
quarterly Operating Profit.
Movements in our share price in Q4 had a sizeable impact on our reported
results, although the business would have been profitable regardless.
The stock price decline resulted in a significant reduction of accrued
social costs for stock options and RSUs, leading to a significant delta
between our guidance and reported results. As a reminder, social costs
are payroll taxes associated with employee salaries and benefits,
including stock based compensation. We are subject to social taxes in
several countries in which we operate, although Sweden accounts for the
bulk of the accrued cost. Removing the impact of these costs, our
results would have been slightly above the high end of our Q4 guidance.
Strong gross margin and slower than planned headcount growth were the
primary drivers of this performance.
As of December 31, we had 4,165 full-time employees and contractors
globally. Hiring in the quarter continued to focus heavily on our
Research & Development efforts with more than 40% of headcount additions
in that area.
IFRS 16
Starting January 1, 2019, we adopted the new lease accounting standards
dictated by IFRS 16. This requires that certain leases which were
accounted for as operating leases be treated as capital leases going
forward. Certain leases will be reclassified as assets and liabilities
on the balance sheet which will yield increased depreciation and
interest expense, offset by a reduction in rental expense.
Free Cash Flow
We generated €150 million in net cash flows from operating activities
and €84 million in Free Cash Flow in Q4, up 12% Y/Y. We maintain
positive working capital dynamics, and our goal is to sustain and grow
Free Cash Flow excluding the impact of capital expenditures associated
with the build-out of new and existing offices in New York, London, Los
Angeles, Stockholm, and Boston, among others. We paid out approximately
€65 million associated with our office builds in Q4. We expect to
complete these projects in 2019 at a cost of roughly €200M.
We ended Q4 with €1.8 billion in cash and cash equivalents, restricted
cash, and short term investments.
Growth through Acquisition
Today we announced
that we have entered into definitive agreements to acquire two of the
leading players in the emerging podcast marketplace. We want to acquire
more, and have line-of-sight on total spend of $400-$500M on multiple
acquisitions in 2019. Growing podcast listening on Spotify is an
important strategy for driving top of funnel growth, increased user
engagement, lower churn, faster revenue growth, and higher margins. We
intend to lean into this strategy in 2019, both to acquire exclusive
content and to increase investment in the production of content
in-house. The more successful we are, the more we’ll lean into the
strategy to accelerate our growth, in which case we would update
guidance accordingly.
Q1 2019 AND FULL YEAR OUTLOOK
These forward-looking statements reflect Spotify’s expectations as of
February 6, 2019 and are subject to substantial uncertainty.
NOTE: Our full year guidance includes the revenue and costs associated
with the announced acquisitions that we expect to close in Q1. In
aggregate, the impact of M&A on our guidance includes an increase of
€25-30 million to revenue, a negative impact of 20-30 basis points to
GM, and an increase of €40-50 million to operating expenses.
Q1 2019 Guidance:
-
Total Monthly Active Users (“MAU”): 215-220 million, up 24-27%
Y/Y - Total Premium Subscribers: 97-100 million, up 29-33% Y/Y
- Total Revenue: €1.35-€1.55 billion, up 19-36% Y/Y
- Gross Margin: 22.5-24.5%
- Operating Profit/Loss: €(50)-(€120) million
Full Year 2019 Guidance:
-
Total Monthly Active Users (“MAU”): 245-265 million, up 18-28%
Y/Y - Total Premium Subscribers: 117-127 million, up 21-32% Y/Y
- Total Revenue: €6.35-€6.8 billion, up 21-29% Y/Y
- Gross Margin: 22.0-25.0%
- Operating Profit/Loss: €(200)-(€360) million
As with last year, our quarterly and annual guidance includes an
estimate of the impact of social charges on our financial statements.
This expense can vary materially from quarter to quarter based on
fluctuations in the price of Spotify stock, which impacts our accruals
for future expenses. Our forecast guidance ranges incorporate our best
estimate of the impact of social charges on our income statement;
however, material changes in the value of Spotify’s stock price could
have an outsized impact on our reported profit or loss for the quarter
and/or the year.
WARRANTS
Our founders, Daniel Ek and Martin Lorentzon, hold warrants in the
company. We account for these warrants on a mark-to-market basis in
“Finance Income” on our P&L. In Q4, we recorded a Fair Market Value gain
on these warrants amounting to €373 million, primarily due to the
decrease in our share price in the public market. These gains were
considered in the calculation of Diluted EPS for Q4 and FY 2018.
SHARE REPURCHASE PROGRAM UPDATE
On November 5, 2018, Spotify announced a program to repurchase up to
$1.0 billion of its publicly traded shares. During Q4, the company
repurchased 687,271 shares at a total cost of $87.3 million and an
average cost of $127.01 per share.
EARNINGS QUESTION & ANSWER SESSION
The Company will host a live question and answer session starting at 8
a.m. ET today on investors.spotify.com. Daniel Ek, our Co-Founder and
CEO, and Barry McCarthy, our Chief Financial Officer, will be on hand to
answer questions submitted to ir@spotify.com
and via the live chat window available through the webcast. Participants
also may join using the listen-only conference line:
Participant Toll Free Dial-In Number: (866) 393-4306
Participant
International Dial-In Number: (734) 385-2616
Conference ID 1293144
Use of Non IFRS Measures
This shareholder letter includes references to the non-IFRS financial
measures of EBITDA and Free Cash Flow. Management believes that EBITDA
and Free Cash Flow are important metrics because they present measures
that approximate the amount of cash generated that is available to repay
debt obligations, make investments, and for certain other activities
that excludes certain infrequently occurring and/or non-cash items.
However, these measures should be considered in addition to, not as a
substitute for or superior to, net income, operating income, or other
financial measures prepared in accordance with IFRS. This shareholder
letter also includes references to the non-IFRS financial measures of
Revenue excluding foreign exchange effect, Premium revenue excluding
foreign exchange effect and Ad-Supported revenue excluding foreign
exchange effect. Management believes that Revenue excluding foreign
exchange effect, Premium revenue excluding foreign exchange effect and
Ad-Supported revenue excluding foreign exchange effect are important
metrics because they present measures that facilitate comparison to our
historical performance. Revenue excluding foreign exchange effect,
Premium revenue excluding foreign exchange effect and Ad-Supported
revenue excluding foreign exchange effect should be considered in
addition to, not as a substitute for or superior to, Revenue, Premium
revenue, Ad-Supported revenue or other financial measures prepared in
accordance with IFRS.
Forward Looking Statements
This shareholder letter contains estimates and forward-looking
statements. All statements other than statements of historical fact are
forward-looking statements. The words “may,” “might,” “will,” “could,”
“would,” “should,” “expect,” “plan,” “anticipate,” “intend,” “seek,”
“believe,” “estimate,” “predict,” “potential,” “continue,”
“contemplate,” “possible,” and similar words are intended to identify
estimates and forward-looking statements.
Our estimates and forward-looking statements are mainly based on our
current expectations and estimates of future events and trends, which
affect or may affect our businesses and operations. Although we believe
that these estimates and forward-looking statements are based upon
reasonable assumptions, they are subject to numerous risks and
uncertainties and are made in light of information currently available
to us. Many important factors may adversely affect our results as
indicated in forward-looking statements. These factors include, but are
not limited to: our ability to attract prospective users and to retain
existing users; our dependence upon third-party licenses for sound
recordings and musical compositions; our lack of control over the
providers of our content and their effect on our access to music and
other content; our ability to generate sufficient revenue to be
profitable or to generate positive cash flow on a sustained basis; our
ability to comply with the many complex license agreements to which we
are a party; our ability to accurately estimate the amounts payable
under our license agreements; the limitations on our operating
flexibility due to the minimum guarantees required under certain of our
license agreements; our ability to obtain accurate and comprehensive
information about music compositions in order to obtain necessary
licenses or perform obligations under our existing license agreements;
potential breaches of our security systems; assertions by third parties
of infringement or other violations by us of their intellectual property
rights; competition for users and user listening time; our ability to
accurately estimate our user metrics and other estimates; risks
associated with manipulation of stream counts and user accounts and
unauthorized access to our services; changes in legislation or
governmental regulations affecting us; ability to hire and retain key
personnel; our ability to maintain, protect, and enhance our brand;
risks associated with our international expansion, including
difficulties obtaining rights to stream music on favorable terms; risks
relating to the acquisition, investment, and disposition of companies or
technologies; dilution resulting from additional share issuances;
tax-related risks; the concentration of voting power among our founders
who have and will continue to have substantial control over our
business; risks related to our status as a foreign private issuer;
international, national or local economic, social or political
conditions; and risks associated with accounting estimates, currency
fluctuations and foreign exchange controls.
Other sections of this report describe additional risk factors that
could adversely impact our business and financial performance. Moreover,
we operate in an evolving environment. New risk factors and
uncertainties emerge from time to time, and it is not possible for our
management to predict all risk factors and uncertainties, nor are we
able to assess the impact of all of these risk factors on our business
or the extent to which any risk factor, or combination of risk factors,
may cause actual results to differ materially from those contained in
any forward-looking statements. We qualify all of our forward-looking
statements by these cautionary statements. You should read this report
and the documents that we have filed as exhibits to this report
completely and with the understanding that our actual future results may
be materially different and worse from what we expect.
Interim condensed consolidated statement of operations
(Unaudited)
(in
€ millions, except share and per share data)
| Three months ended | Year ended | |||||||||||||||||||||||||
|
December 31,
2018 |
September 30,
2018 |
December 31,
2017 |
December 31,
2018 |
December 31,
2017 |
||||||||||||||||||||||
| Revenue | 1,495 | 1,352 | 1,149 | 5,259 | 4,090 | |||||||||||||||||||||
| Cost of revenue | 1,096 | 1,010 | 867 | 3,906 | 3,241 | |||||||||||||||||||||
| Gross profit | 399 | 342 | 282 | 1,353 | 849 | |||||||||||||||||||||
| Research and development | 100 | 135 | 123 | 493 | 396 | |||||||||||||||||||||
| Sales and marketing | 163 | 146 | 173 | 620 | 567 | |||||||||||||||||||||
| General and administrative | 42 | 67 | 73 | 283 | 264 | |||||||||||||||||||||
| 305 | 348 | 369 | 1,396 | 1,227 | ||||||||||||||||||||||
| Operating income/(loss) | 94 | (6 | ) | (87 | ) | (43 | ) | (378 | ) | |||||||||||||||||
| Finance income | 389 | 10 | 36 | 455 | 118 | |||||||||||||||||||||
| Finance costs | (2 | ) | (85 | ) | (545 | ) | (584 | ) | (974 | ) | ||||||||||||||||
| Share in (losses)/earnings of associate | — | (1 | ) | — | (1 | ) | 1 | |||||||||||||||||||
| Finance income/(costs) – net | 387 | (76 | ) | (509 | ) | (130 | ) | (855 | ) | |||||||||||||||||
| Loss before tax | 481 | (82 | ) | (596 | ) | (173 | ) | (1,233 | ) | |||||||||||||||||
| Income tax expense/(benefit) | 39 | (125 | ) | — | (95 | ) | 2 | |||||||||||||||||||
|
Net income/(loss) attributable to owners of the parent |
442 | 43 | (596 | ) | (78 | ) | (1,235 | ) | ||||||||||||||||||
|
Earnings/(loss) per share attributable to owners of the parent |
||||||||||||||||||||||||||
| Basic | 2.44 | 0.24 | (3.87 | ) | (0.44 | ) | (8.14 | ) | ||||||||||||||||||
| Diluted | 0.36 | 0.23 | (3.87 | ) | (0.51 | ) | (8.14 | ) | ||||||||||||||||||
| Weighted-average ordinary shares outstanding | ||||||||||||||||||||||||||
| Basic | 181,067,994 | 180,510,524 | 154,126,524 | 177,154,405 | 151,668,769 | |||||||||||||||||||||
| Diluted | 190,511,148 | 188,120,122 | 154,126,524 | 181,210,292 | 151,668,769 | |||||||||||||||||||||
Condensed consolidated statement of financial position
(Unaudited)
(in
€ millions)
|
December 31,
2018 |
December 31,
2017 |
||||||||||
| Assets | |||||||||||
| Non-current assets | |||||||||||
| Property and equipment | 197 | 73 | |||||||||
| Intangible assets including goodwill | 174 | 162 | |||||||||
| Investment in associate | — | 1 | |||||||||
| Long term investments | 1,646 | 910 | |||||||||
| Restricted cash and other non-current assets | 65 | 54 | |||||||||
| Deferred tax assets | 8 | 9 | |||||||||
| 2,090 | 1,209 | ||||||||||
| Current assets | |||||||||||
| Trade and other receivables | 400 | 360 | |||||||||
| Income tax receivable | 2 | — | |||||||||
| Short term investments | 915 | 1,032 | |||||||||
| Cash and cash equivalents | 891 | 477 | |||||||||
| Other current assets | 38 | 29 | |||||||||
| 2,246 | 1,898 | ||||||||||
| Total assets | 4,336 | 3,107 | |||||||||
| Equity and liabilities | |||||||||||
| Equity | |||||||||||
| Share capital | — | — | |||||||||
| Other paid in capital | 3,801 | 2,488 | |||||||||
| Treasury shares | (77 | ) | — | ||||||||
| Other reserves | 875 | 177 | |||||||||
| Accumulated deficit | (2,505 | ) | (2,427 | ) | |||||||
| Equity attributable to owners of parent | 2,094 | 238 | |||||||||
| Non-current liabilities | |||||||||||
| Convertible notes | — | 944 | |||||||||
| Accrued expenses and other liabilities | 85 | 56 | |||||||||
| Provisions | 8 | 6 | |||||||||
| Deferred tax liabilities | 2 | 3 | |||||||||
| 95 | 1,009 | ||||||||||
| Current liabilities | |||||||||||
| Trade and other payables | 427 | 341 | |||||||||
| Income tax payable | 5 | 9 | |||||||||
| Deferred revenue | 258 | 216 | |||||||||
| Accrued expenses and other liabilities | 1,076 | 881 | |||||||||
| Provisions | 42 | 59 | |||||||||
| Derivative liabilities | 339 | 354 | |||||||||
| 2,147 | 1,860 | ||||||||||
| Total liabilities | 2,242 | 2,869 | |||||||||
| Total equity and liabilities | 4,336 | 3,107 | |||||||||
Interim condensed consolidated statement of cash flows
(Unaudited)
(in
€ millions)
| Three months ended | Year ended | |||||||||||||||||||||||||
|
December 31,
2018 |
September 30,
2018 |
December 31,
2017 |
December 31,
2018 |
December 31,
2017 |
||||||||||||||||||||||
| Operating activities | ||||||||||||||||||||||||||
| Net income/(loss) | 442 | 43 | (596 | ) | (78 | ) | (1,235 | ) | ||||||||||||||||||
| Adjustments to reconcile net loss to net cash flows | ||||||||||||||||||||||||||
| Depreciation of property and equipment | 4 | 4 | 11 | 21 | 46 | |||||||||||||||||||||
| Amortization of intangible assets | 4 | 3 | 2 | 11 | 8 | |||||||||||||||||||||
| Share-based payments expense | 23 | 24 | 14 | 88 | 65 | |||||||||||||||||||||
| Finance income | (389 | ) | (10 | ) | (36 | ) | (455 | ) | (118 | ) | ||||||||||||||||
| Finance costs | 2 | 85 | 545 | 584 | 974 | |||||||||||||||||||||
| Income tax expense/(benefit) | 39 | (125 | ) | — | (95 | ) | 2 | |||||||||||||||||||
| Share in losses/(earnings) of associate | — | 1 | — | 1 | (1 | ) | ||||||||||||||||||||
| Other | 15 | (6 | ) | (4 | ) | 7 | (3 | ) | ||||||||||||||||||
| Changes in working capital: | ||||||||||||||||||||||||||
|
Increase in trade receivables |
(59 | ) | (29 | ) | (46 | ) | (61 | ) | (112 | ) | ||||||||||||||||
| Increase in trade and other liabilities | 57 | 86 | 195 | 291 | 447 | |||||||||||||||||||||
| Increase in deferred revenue | 17 | 5 | 43 | 38 | 77 | |||||||||||||||||||||
| (Decrease)/increase in provisions | (7 | ) | (3 | ) | (39 | ) | (17 | ) | 8 | |||||||||||||||||
| Interest received | 3 | 3 | 6 | 18 | 19 | |||||||||||||||||||||
| Income tax (paid)/received | (1 | ) | (1 | ) | — | (9 | ) | 2 | ||||||||||||||||||
| Net cash flows from operating activities | 150 | 80 | 95 | 344 | 179 | |||||||||||||||||||||
| Investing activities | ||||||||||||||||||||||||||
| Purchases of property and equipment | (65 | ) | (49 | ) | (21 | ) | (125 | ) | (36 | ) | ||||||||||||||||
| Purchases of short term investments | (300 | ) | (54 | ) | (482 | ) | (1,069 | ) | (1,386 | ) | ||||||||||||||||
| Sales and maturities of short term investments | 66 | 279 | 237 | 1,226 | 1,080 | |||||||||||||||||||||
| Change in restricted cash | (1 | ) | 2 | 1 | (10 | ) | (34 | ) | ||||||||||||||||||
| Other | — | (22 | ) | (14 | ) | (44 | ) | (59 | ) | |||||||||||||||||
| Net cash flows (used in)/from investing activities | (300 | ) | 156 | (279 | ) | (22 | ) | (435 | ) | |||||||||||||||||
| Financing activities | ||||||||||||||||||||||||||
| Proceeds from exercise of share options | 17 | 50 | 7 | 163 | 29 | |||||||||||||||||||||
| Purchases of treasury shares | (72 | ) | — | — | (72 | ) | — | |||||||||||||||||||
| Other | — | (1 | ) | — | 1 | 5 | ||||||||||||||||||||
| Net cash flow (used in)/from financing activities | (55 | ) | 49 | 7 | 92 | 34 | ||||||||||||||||||||
| Net increase in cash and cash equivalents | (205 | ) | 285 | (177 | ) | 414 | (222 | ) | ||||||||||||||||||
| Cash and cash equivalents at beginning of the period | 1,095 | 810 | 668 | 477 | 755 | |||||||||||||||||||||
|
Net exchange gains/(losses) on cash and
cash equivalents |
1 | — | (14 | ) | — | (56 | ) | |||||||||||||||||||
| Cash and cash equivalents at period end | 891 | 1,095 | 477 | 891 | 477 | |||||||||||||||||||||
Reconciliation of IFRS to Non-IFRS Results
(Unaudited)
(in
€ millions, except percentages)
| Three months ended | Year ended | |||||||||||||||||||
|
December 31,
2018 |
December 31,
2017 |
December 31,
2018 |
December 31,
2017 |
|||||||||||||||||
| IFRS revenue | 1,495 | 1,149 | 5,259 | 4,090 | ||||||||||||||||
|
Foreign exchange effect on 2018 revenue using 2017 rates |
2 | 202 | ||||||||||||||||||
| Revenue excluding foreign exchange effect | 1,497 | 5,461 | ||||||||||||||||||
| IFRS revenue year-over-year change % | 30 | % | 29 | % | ||||||||||||||||
|
Revenue excluding foreign exchange effect year-over-year change % |
30 | % | 34 | % | ||||||||||||||||
| IFRS Premium revenue | 1,320 | 1,018 | 4,717 | 3,674 | ||||||||||||||||
|
Foreign exchange effect on 2018 Premium revenue using 2017 rates |
6 | 184 | ||||||||||||||||||
|
Premium revenue excluding foreign exchange effect |
1,326 | 4,901 | ||||||||||||||||||
| IFRS Premium revenue year-over-year change % | 30 | % | 28 | % | ||||||||||||||||
|
Premium revenue excluding foreign exchange effect year-over-year |
30 | % | 33 | % | ||||||||||||||||
| IFRS Ad-Supported revenue | 175 | 130 | 542 | 416 | ||||||||||||||||
|
Foreign exchange effect on 2018 Ad-Supported revenue using 2017 |
(4 | ) | 18 | |||||||||||||||||
| Ad-Supported revenue excluding foreign exchange effect | 171 | 560 | ||||||||||||||||||
| IFRS Ad-Supported revenue year-over-year change % | 34 | % | 30 | % | ||||||||||||||||
|
Ad-Supported revenue excluding foreign exchange effect |
31 | % | 35 | % | ||||||||||||||||
Contacts
Investor Relations:
Paul Vogel
ir@spotify.com
Public Relations:
Dustee Jenkins
press@spotify.com