
Axon 2023 Revenue Grows 31% to $1.56 Billion
SCOTTSDALE, Ariz., Feb. 27, 2024 /PRNewswire/ —
- Axon Cloud and Services revenue grows 52% to $561 million
- Annual recurring revenue grows 47% to $697 million
- Annual net income of $174 million supports Adjusted EBITDA of $329 million
- Company projects Full Year 2024 revenue of $1.88 billion to $1.94 billion, representing 20% to 24% annual growth
Fellow shareholders,
Axon is delighted to deliver another year of record company performance, fueled by product innovation, partnership with our customers and strong industry trends. Demand for our mission-driven product ecosystem continued to grow in the fourth quarter of 2023, and we recorded our fifth consecutive year of 25% or greater revenue growth, growing 31% year over year. We achieved this growth with a full year net income margin of 11% and Adjusted EBITDA margin of 21%.

Our core measure of success as a company is progress on our mission to protect life. Our mission aligns our people, our customers and our communities. Together, we focus on solving problems with modern technology, pioneering new ways of thinking and taking new approaches to complex social dynamics, driving toward our moonshot goal to cut gun-related deaths between police and the public in half by 2033. In this first year after announcing our moonshot, we introduced new technology, new modern training capabilities and new sources of improved data and analytics. We’ve laid the groundwork for the next nine years, and we are just getting started.
Our mission and products have resonated with our customers and afford us a growing pipeline across our business. In 2024, Axon expects to deliver annual revenue in a range of $1.88 billion to $1.94 billion, and Adjusted EBITDA of $410 million to $430 million, reflecting more than 20% annual growth and continued Adjusted EBITDA margin expansion from the prior year. We are propelling our growth through innovation and diversification while realizing efficiencies and leverage on our business as it scales. We are humbled to enter a new year with robust expectations for each of our product categories and customer verticals. In this letter, we recap a historic 2023 for our company and provide an update on the opportunities we see ahead, our roadmap and our progress.
2023 Key Takeaways
Commitment to being a Force for Good
Axon’s mission is embodied in our moonshot goal to cut gun-related deaths between police and the public by 50% over 10 years. 2023 was the first year in our moonshot journey, and we progressed significant advancements to help us achieve this goal, including introducing technology, new ways of training, and optimized data collection and reporting with the Axon Public Safety Gun Fatality Database. We also published our Force For Good report in November, a bi-annual update on our progress in the areas of Corporate Social Responsibility. In addition, we summarize 5 Giant Leaps we made over the last year, here.
Strong financial results
Axon delivered annual revenue of $1.56 billion and net income of $174 million in 2023. This represents 31% annual revenue growth and an 11.1% net income margin, supporting Adjusted EBITDA of $329 million (21.1% margin). We are delivering profitable growth at scale and improvement in our operating expenses as a percentage of revenue was primarily driven by leverage on sales, general and administrative (“SG&A”) expenses. Axon continues to grow our research and development (“R&D”) footprint to invest in several multi-year growth opportunities, and our R&D expenses grew roughly in-line with revenue. 2023 revenue and Adjusted EBITDA margin exceeded our expectations and reflect record performance for our company.
Product innovation
We power our business through relentless product innovation. In 2023, years of investments materialized in two major new product launches — TASER 10 and Axon Body 4 — and a number of advancements in our ecosystem, including groundbreaking real-time communications features such as two-way voice communications and WatchMe, as well as an expanded virtual reality (“VR”) training suite including all-new bespoke TASER VR controllers alongside expanded training content and more. We also reached key adoption milestones, including new deployments bringing us to over 100 agencies live on one or more modules of Axon Records.
New customer vertical expansion
Axon has diversified beyond U.S. state and local law enforcement. In 2023, we achieved significant growth in emerging customer verticals, including U.S. federal, international, justice, corrections and enterprise. A few examples of our progress include the successful deployment of Axon Records with the U.S. Department of Veterans Affairs, two of our largest TASER 10 orders coming from international and corrections customers, and our partnership with the Government of Scotland to power its digital evidence management system across courts, lawyers, government and police. We also have several trials kicking off with our newly launched product for enterprise, including Fairview Health, where they are trialing Body Workforce with nurses as part of their commitment to patient and staff safety.
Strategic investments to further enhance our ecosystem and expand our TAM
Axon’s investment and partner strategy is geared to accelerate our product roadmap and enhance our ecosystem while building our talent base in product categories accretive to our long-term growth. In 2023, we acquired Sky-Hero and earlier this month we announced our acquisition of Fusus. Sky-Hero is an example of an acquisition supporting Axon in building next-generation technology in public safety that will leverage enhanced robotic security capabilities to improve situational awareness, power more effective means of response and protect life. With Fusus, Axon advances mission control, the future of real-time operations for public safety, enabling customers to aggregate live video, data and sensor feeds from virtually any source. Even without updating our core total addressable market (“TAM”), which we updated last year and update on a bi-annual basis, these acquisitions expand Axon’s TAM from $50 billion to more than $63 billion.
Select Highlights
Product Traction & Ecosystem Expansion
Axon has set out to build the technology ecosystem for public safety — to enable our customers to protect life, capture truth and accelerate justice. We invest incrementally each year to consistently develop and deliver new game-changing technology while simultaneously enhancing our existing products. When our products resonate with our customers, we see strong demand and a growing opportunity set of expanding relationships, measurable through new product traction and increasing adoption of the expanding Axon software ecosystem surrounding those new products. This affords us the opportunity to further invest in new technology categories and applications, both through our continued investment in R&D and through strategic investment, fueling our future product innovation, expansion and growth.
Product highlights from this past year are examples of this strategy at work:
Our two most successful product launches together in a single year
The successful launch and ramp of TASER 10 and Axon Body 4 in the same year is evidence of what our team is able to accomplish.
After over five years of development, our latest TASER device features new game changing technology, including individually targeted probes, the ability to deploy up to 10 probes, and a longer range of up to 45 feet, along with a host of other features and upgrades that make this latest generation TASER product the best yet. These are major steps toward where we see the future of this critical technology, and together they are generating unprecedented demand from our customers.
At the same time, our operational advancements are measurable in our execution in launching the product. In 2023, we shipped over 50,000 units of TASER 10 and the new product was our top selling TASER device in the fourth quarter.
“TASER 10 is now our fastest growing TASER product in history.” — Rick Smith, Axon Founder and CEO
Following the launch of TASER 10 in January 2023, we introduced Axon Body 4 in April 2023, which has quickly become our fastest selling body camera product to date. Axon Body 4 includes a host of advancements from prior generation body cameras, including expanded communications abilities, more points of view, upgraded camera features and more streamlined operations. We shipped more than 100,000 units of Axon Body 4 in the second half of 2023, only months after introducing this next generation body camera product to market.
“As Sheriff of Bernalillo County, I’ve witnessed firsthand the profound impact that the new TASER 10 audible and visual warning alert system has had on our law enforcement efforts. The innovative design, featuring a bright pulsing light paired with a loud alert sound, has significantly enhanced our deputies’ ability to gain compliance from initially non-compliant suspects without the need to deploy cartridges. This technology is not just about maintaining safety; it’s about escalating our approach to de-escalation. We’ve observed that this generation, in particular, responds strongly to the visual and audible cues of the TASER 10 warning alert. It captures their attention and conveys a clear message that they need to reconsider their actions. This tool has been invaluable in our mission to protect and serve, offering a powerful alternative that benefits both our deputies and our team and the results in the field speak volumes to the effectiveness of this approach. The TASER 10 is a testament to the evolution of law enforcement tools towards safer, more effective outcomes.” — Sheriff Josh Allen, Bernalillo County (NM) Sheriff’s Office
Software innovation supporting multiple vectors of growth
We describe our software products as belonging to three major categories: 1) digital evidence management, 2) real-time operations and 3) productivity software. Within our software portfolio, we deliver right-sized and custom subscription plans that can be configured to meet the needs of any customer, and we support customers in their journeys to build world-class public safety organizations. Most often, our customers initially adopt cloud digital evidence management licenses included with our standard product subscription plans for Axon Body, Axon Fleet, TASER, interview rooms and Officer Safety PlanS.
Over time, we see customers opting to upgrade to additional product features and categories — this includes adding premium digital evidence management features, such as Axon Performance, Auto-Tagging and Redaction Assistant, as well as our real-time operations, live-streaming and two-way voice communications capabilities with Axon Respond and productivity software with Axon Standards and Axon Records. Our net revenue retention of 122% in the fourth quarter of 2023 reflects our success in selling new premium features to our existing customers.
“Best of all, as the agency continues to leverage [Axon] Respond, everyone in the agency can have a voice in maximizing the technology — officers, for example, can proactively request assistance from supervisors at complicated scenes. This is why supervisors at Las Cruces have been transparent about when and how it’s being used. The more [patrol officers] know about it, they get creative and [think of] ways to use it I’m not even aware of…and then they let me know and it makes everyone better” — Officer Benavidez, Las Cruces (NM) Police Department
Strategic acquisition of Fusus accelerates and further unleashes Axon real-time operations
In addition to our R&D, Axon also leverages partnerships to deliver on our product vision. We take a technology first strategic approach to reviewing potential partners and believe it benefits our customers when we can provide them more of an ecosystem opportunity. Sometimes we also see the opportunity to make minority investments in select partners to further align our goals on delivering strategic outcomes to customers. Fusus was one of those partners where we saw strong alignment between our products, we invested in them as a company, and now we’re thrilled to have acquired them to more fully support our ecosystem vision for real-time operations.
An immediate benefit from this acquisition is empowering customers to securely access existing CCTV and other camera feeds from key sources like local businesses in the community — with appropriate permissions — to see events unfolding in real-time with greater context and clarity. This open platform improves crucial real-time situational awareness for our customers, while directly facilitating collaborative community partnerships.
Over time, real-time crime centers powered by Axon and Fusus will safely and securely connect to an increasingly wide range of data sources beyond Axon devices, including fixed, body-worn, in-car, and automated license plate recognition (“ALPR”) cameras; gunshot detection sensors, social media feeds and various other sensors and systems — again, with appropriate permissions. By aggregating all of this information into a single pane of glass, real-time crime centers can further improve situational awareness, reduce response times and support proactive crime prevention efforts by leveraging up-to-minute information and analytics. We enable information to be quickly and easily shared between collaborating agencies, ensuring accelerated justice for all involved, another point of expansion into additional emerging product areas for our company. We believe Fusus adds approximately $13 billion to our TAM opportunity, bringing our total real-time operations TAM to $16 billion, which we discuss in more detail later in this letter.
Real-time operations is an example of Axon’s product innovation driving category creation. Axon introduced live-streaming through a body camera to the market with Axon Body 3 and further advanced on our vision with direct two-way voice communications with Axon Body 4. We believe the integration of Fusus into this product category will be accretive to our long-term growth, and we saw early signs of success leading into this strategic acquisition.
Laying the groundwork for a new phase of product innovation with Sky-Hero and Axon Air
Axon Air is our product category that powers applications for robotic security, which we believe holds significant promise in achieving our moonshot goal, and as a driver of future growth. We think utilizing robotic systems in tactical high-risk situations to create more distance and time, two critical factors that can drastically change outcomes for the better, will become a mission-critical tool leveraged in the future of public safety operations. Ultimately, we aim to enable customers to reduce the number of times where humans are forced to face high-risk, potentially life-altering situations.
Axon Air also supports use cases for drones to increase situational awareness, providing an additional point of view for an evolving incident or enabling better visibility into surveying and disaster search efforts. In crime scene investigations, Axon Air powered drones can be leveraged to uncover otherwise undiscoverable evidence to support resolution. Finally, drone as a first responder (“DFR”) is a growing application where the utilization of drone technology can reduce emergency response times and act as a force multiplier.
We have leveraged our internal talent, as well as strategic partnerships and our Sky-Hero acquisition, in this emerging product category. Along with our partners, we are able to drive robotic security applications and ensure secure operating conditions for this future technology through highly advanced software and systems. We estimate Sky-Hero’s current products expand our TAM for Axon Air by more than $400 million to $4.5 billion.
“It didn’t take long for us to realize the value of drones. Now we use them for everything. After the traffic division, detectives started using drones for crime scene documentation. Then SWAT started using them. And now, every patrol crew has a drone and pilot. We tell our people if there’s a situation where you think a drone would be useful, just try it out to see.” — Chad Karlewicz, Commander of Special Operations, Renton (WA) Police Department
Updating TAM for our Expanding Ecosystem
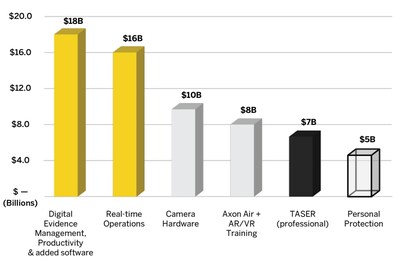
In the beginning of 2023, we updated our TAM analysis to reflect the opportunities we see ahead in each of our product categories, with a breakdown into the primary product drivers, including digital evidence management, real-time operations and productivity software, camera hardware, Axon Air, AR/VR training, TASER professional and personal protection. Our findings resulted in a TAM of approximately $50 billion, which we will update in full again at the beginning of 2025.
However, we have updated our TAM with respect to the acquisitions of Sky-Hero and Fusus. In total, these additions to our ecosystem expand Axon’s TAM to $63 billion in 2024.
Our efforts to build the technology ecosystem for public safety go beyond our product strategy. We are also diversifying our business by growing our presence with new types of customer profiles, or users, and by adding to our core customer base. This materializes through Axon selling into additional categories of funding sources beyond U.S. state and local governments, including the U.S. federal government, international governments, enterprises and civilians. Simultaneously, the types of customers, or verticals, who find value in our product offerings expand beyond law enforcement to include attorneys, fire and emergency medical services (“EMS”) personnel, corrections and the U.S. military.
")
As we recap our progress over the last year, we are providing a breakdown of our 2023 TAM by funding source to highlight an additional view into our opportunities. Collectively, customer funding sources outside U.S. state and local governments account for the majority of the TAM we pursue today.
- $15 billion in U.S. state and local governments, including more than 900,000 law enforcement personnel between sworn and civilian roles and more than 400,000 vehicles. In addition, we estimate approximately 30% of our U.S. state and local customer TAM comprises adjacent public safety customer verticals outside of law enforcement, including justice, with over 700,000 legal professionals involved in criminal justice between attorneys and paralegals; corrections, with approximately 500,000 corrections, probation, and child services officers; fire, with approximately 1 million career and volunteer firefighters; and EMS, with over 250,000 paramedics. We estimate that our acquisitions of Fusus and Sky-Hero added nearly $3 billion to our U.S. state and local government TAM.
- $10 billion in U.S. federal government, with more than 2 million potential users and over 300,000 vehicles across various branches of the U.S. federal government, including the U.S. Department of Defense, U.S. Department of Justice, U.S. Department of Homeland Security, U.S. Department of Veterans Affairs and U.S. Department of State, to name a few.
- $19 billion in international governments, where a single-country opportunity presents a 200,000 or larger potential user base and, together, the potential user base of international law enforcement and adjacencies totals to approximately 10x the user base of U.S. state and local law enforcement. We estimate that our acquisitions of Fusus and Sky-Hero added over $3 billion to our international government TAM.
- $15 billion in enterprise, comprising more than 20 million potential users in the United States, including retail associates, technicians, transportation and warehouse employees, and private security professionals, among others. Our recent acquisition of Fusus nearly doubled our enterprise opportunity, adding $7 billion to this TAM, with Fusus technology helping unlock our opportunity to access fixed video and CCTV feeds within our ecosystem.
- $5 billion in civilian personal protection.
Our TAM estimates are based on publicly available data on user counts, our estimate of in-scope users for our products over the next three years, by product and user category, and our estimated potential value of applicable products. We reference the most up to date data published by national governments, surveys and studies and proprietary information in the production of our TAM estimates. The product and vertical level TAMs shown have been rounded to the nearest whole number and will not arrive at our total TAM of $63 billion when added together due to rounding.
Growing Customer Verticals
Each year, we provide updates on our progress and activity in select customer verticals where we have directed our investment. Last quarter, we discussed our progress in U.S. federal and international, two areas that have become driving forces of our growth beyond the growth we see with our U.S. state and local law enforcement customers. As we recap our year, we are providing an additional update on corrections, a fast-growing adjacent public safety vertical, and enterprise, where our new product introductions open further applications for our technology in the private sector, including private security, retail and healthcare.
The future of technology and corrections
One area where we have identified the opportunity to enable safe means of de-escalation while improving transparency is in the corrections vertical — which, as we described above, increases our potential domestic user base by approximately 50% relative to U.S. state and local law enforcement.
We introduced TASER devices to corrections customers to provide a means to safely de-escalate conflict without violence, particularly useful in a correctional environment, and have found strong new customer fit for this product. In fact, our second largest TASER 10 order has come from a corrections customer in the United States. Further, conversations during our recent participation at the annual conference of the Florida Council on Crime and Delinquency validated our strategy to drive body camera adoption in this emerging customer vertical for Axon. Body cameras were discussed as an accountability and transparency tool to keep corrections facilities safe, and our growing pipeline with this customer vertical supports our investment here. Corrections was our top growing adjacent customer vertical in 2023.
“Body-worn cameras have deterred use of force in our facility” — Correctional Officer, Hardee (FL) Correctional Institution
Introducing Axon Body Workforce for enterprise
In January, we announced our first ever dedicated enterprise vertical product, Axon Body Workforce. This new generation of body cameras is designed for frontline workers in retail stores and healthcare facilities and adapts the same life-saving technology trusted by our public safety customers. Axon has identified applications in retail, healthcare and other areas within enterprise where body cameras are a tool to promote personal safety for employees at work. In addition to deterring and de-escalating incidents with the presence of a camera, Axon Body Workforce integrates Axon’s real-time capabilities and digital evidence management workflows, allowing for quicker and more effective interventions and making it easier to act on captured footage. We have kicked off several customer trials with this newly launched product for enterprise.
The enterprise vertical also includes applications in private security, which more closely mirror public safety professional use cases. Private security use of Axon technology facilitates collaboration between local public safety professionals and governments, creating efficiencies and improving transparency. Examples of current customer applications include private security professionals in stadiums, theme parks and other secured public spaces. Within our potential enterprise user base, the U.S. Bureau of Labor Statistics reports there are approximately 1 million private security professionals employed in the United States, today.
“Public safety is about just that — people feeling and being safe in public, including while at work.” — Rick Smith, Axon Founder and CEO.
Q4 2023 Summary Results
- Quarterly revenue of $432 million exceeded our expectations and grew 28.6% year over year driven by strong demand across product categories. Axon Cloud software was the primary driver, with increasing adoption of our premium add-on features, a growing base of software licenses associated with Axon Fleet systems and expansion into new customers supporting growth in our now largest product category. Ramping shipments of TASER 10 and Axon Body 4 also supported our growth as demand for both new products continues to build.
- Total company gross margin of 61.1% declined 10 basis points year over year, primarily driven by lower TASER gross margin, partially offset by a higher Sensors gross margin and increased mix to Axon Cloud and Services.
- Operating profit of $43 million increased 89.9% year over year driven by higher revenue and operating leverage. Operating expenses of $221 million included $33 million in stock-based compensation expenses. Operating expenses as a percent of revenue improved to 51.2% as compared to 54.5% in the Q4 2022.
- SG&A expense of $137 million, 31.7% of revenue, included $15 million in stock-based compensation expenses.
- R&D expense of $84 million, 19.4% of revenue, included $18 million in stock-based compensation expenses.
- Net income of $57 million (13.3% net income margin, compared to 8.7% in Q4 2022), or $0.75 per diluted share, supported non-GAAP net income of $85 million (19.8% margin), or $1.12 per diluted share.
- Adjusted EBITDA of $91 million reflected an Adjusted EBITDA margin of 21.1%. Adjusted EBITDA margin expanded from 19.6% in Q4 2022 driven by operating leverage.
- Both Non-GAAP net income and Adjusted EBITDA exclude stock-based compensation expenses and net gains or losses related to our strategic investment portfolio.
- Operating cash flow of $140 million in the quarter supported Free Cash Flow of $116 million and Adjusted Free Cash Flow of $121 million.
- As of December 31, 2023, Axon had $1.2 billion in cash, cash equivalents and investments, and outstanding convertible notes in principal amount of $690 million, for a net cash position of $553 million, up $121 million sequentially.
Financial commentary by segment
|
Software & Sensors |
||||||||||||||||||
|
THREE MONTHS ENDED |
CHANGE |
|||||||||||||||||
|
31 DEC 2023 |
30 SEP 2023 |
31 DEC 2022 |
QoQ |
YoY |
||||||||||||||
|
(in thousands) |
||||||||||||||||||
|
Axon Cloud and Services revenue(1) |
$ |
163,632 |
$ |
147,963 |
$ |
113,538 |
10.6 |
% |
44.1 |
% |
||||||||
|
Axon Cloud gross margin |
74.6 |
% |
72.4 |
% |
75.5 |
% |
220 |
bp |
(90) |
bp |
||||||||
|
Sensors and Other revenue |
$ |
107,167 |
$ |
103,068 |
$ |
85,867 |
4.0 |
% |
24.8 |
% |
||||||||
|
Sensors and Other gross margin |
46.3 |
% |
45.2 |
% |
41.5 |
% |
110 |
bp |
480 |
bp |
||||||||
|
(1) |
The TASER segment includes Cloud and Services revenue, which is not broken out here. |
|||||||
- Axon Cloud and Services revenue growth of 44.1% year over year reflects user growth, increasing adoption of premium add-on features related to Axon Evidence, real-time operations and productivity software, a growing base of software licenses associated with Axon Fleet systems and associated growth in professional services installations.
- Axon Cloud and Services gross margin of 74.6% decreased modestly year over year due to higher professional services costs related to Axon Fleet Systems installations. Our software-only gross margin continues to exceed our software gross margin target of 80%.
- Sensors and Other revenue growth of 24.8% year over year was driven by growth in Axon body cameras and accessories, primarily due to strength in demand for Axon Body 4.
- Sensors and Other gross margin of 46.3% increased year over year due to scale efficiencies on fixed costs and mix towards premium products, including Axon Body 4.
|
TASER |
||||||||||||||||||
|
THREE MONTHS ENDED |
CHANGE |
|||||||||||||||||
|
31 DEC 2023 |
30 SEP 2023 |
31 DEC 2022 |
QoQ |
YoY |
||||||||||||||
|
(in thousands) |
||||||||||||||||||
|
Revenue |
$ |
161,343 |
$ |
162,570 |
$ |
136,737 |
(0.8) |
% |
18.0 |
% |
||||||||
|
Gross margin |
57.1 |
% |
62.5 |
% |
61.6 |
% |
(540) |
bp |
(450) |
bp |
||||||||
- TASER segment revenue growth of 18% year over year was driven by the continued ramp of TASER 10, partially offset by a decline in TASER 7, which remained flat quarter over quarter.
- TASER segment gross margin of 57.1% decreased from 61.6% year over year primarily due to a 420 basis point headwind from warranty reserve charges recognized in the quarter related to a TASER 7 production issue that occurred largely in March 2023. Without this charge, TASER gross margins would have been down modestly due to mix. As a reminder, we are still ramping to scale volumes on TASER 10 and expect to make substantial progress in 2024, including moving to more automated production in the second half of the year.
|
Forward-looking performance indicators |
||||||||||||||||||||
|
31 DEC 2023 |
30 SEP 2023 |
30 JUN 2023 |
31 MAR 2023 |
31 DEC 2022 |
||||||||||||||||
|
($ in millions) |
||||||||||||||||||||
|
Annual recurring revenue (1) |
$ |
697 |
$ |
619 |
$ |
559 |
$ |
520 |
$ |
473 |
||||||||||
|
Net revenue retention (1) |
122 |
% |
122 |
% |
122 |
% |
121 |
% |
121 |
% |
||||||||||
|
Total company future contracted revenue (1) |
$ |
7,140 |
$ |
5,819 |
$ |
5,227 |
$ |
4,778 |
$ |
4,647 |
||||||||||
|
(1) |
Refer to “Statistical Definitions” below. |
|||||||
- Annual recurring revenue grew 47% year over year to $697 million, driven by Axon Cloud software growth, which reflects growing demand for our high-value software bundles and a growing base of connected devices in our ecosystem.
- Net revenue retention was 122% in the quarter, reflecting our ability to deliver additional value to our customers over time and de minimis attrition. We drive adoption of our cloud software solutions through subscription plans, which include a variety of premium software options. This Software-as-a-Service (“SaaS”) metric excludes the hardware portion of customer subscriptions and is normalized to account for phased customer deployments throughout the year.
- Total company future contracted revenue grew to $7.1 billion. We expect to recognize between 15% to 25% of this balance over the next 12 months, and generally expect the remainder to be recognized over the following ten years.
2024 Outlook
The following forward-looking statements reflect Axon’s expectations as of February 27, 2024, and are subject to risks and uncertainties. Please refer to “Forward-looking statements” below for more information.
- Axon expects full year 2024 revenue of $1.88 billion to $1.94 billion, representing approximately 20% to 24% annual growth.
- Axon expects a full year 2024 Adjusted EBITDA dollars of $410 million to $430 million, implying continued Adjusted EBITDA margin expansion from 2023.
- We provide Adjusted EBITDA guidance, rather than net income guidance, due to the inherent difficulty of forecasting certain types of expenses and gains such as stock-based compensation, income tax expenses and gains or losses on marketable securities and strategic investments, which affect net income but not Adjusted EBITDA. We are unable to reasonably estimate the impact of such expenses, which could be material, on net income. Accordingly, we do not provide a reconciliation of projected net income to projected Adjusted EBITDA.
- We expect stock-based compensation expenses to be approximately $205 million to $220 million for the full year.
- Full year expected stock based compensation expense includes approximately $42 million in expenses related to an enhanced equity compensation opportunity provided to employees whose compensation is under a specified threshold. We expect this expense to be primarily reflected within cost of goods sold with approximately half of the full year expense to be recognized in the first quarter, in line with vesting schedules which will occur over the next four years.
- Because our stock-based compensation expenses may vary based on changes in our stock price or the actual timing of attainment of certain metrics, it is inherently difficult to forecast future stock-based compensation expense, which may also be materially affected by any future stock-based compensation plans, subject to shareholder approval.
- We expect 2024 CapEx to be in the range of $60 million to $75 million. Our 2024 CapEx plans include investments in TASER 10 automation and capacity expansion, including cartridge capacity and lab enhancements and global facility build-out and upgrades, including warehousing support for global shipping facilities.
Long-Term Outlook
Looking ahead, we remain confident in our ability to scale globally, to penetrate new customer verticals and to introduce new products that drive highly profitable revenue growth as we progress on our mission to protect life. We believe our future opportunities will enable us to drive solid top and bottom-line growth, generate significant cash flow, and create meaningful value for our shareholders.
Last year at this time, we provided a three-year target model for 2025, including a revenue target of $2 billion, implying a 20% revenue compound annual growth rate (“CAGR”), and a 25% Adjusted EBITDA margin target. Given our strong revenue performance in 2023 and new 2024 guidance, which we are proud to provide above our outlook from this time last year, along with our progress on margin expansion, we are updating our long-term framework.
Beyond 2024, we expect to achieve continued 20% or greater compound annual revenue growth and continue to target Adjusted EBITDA margins of approximately 25% as we continue to balance investing for growth and delivering strong profitability. We also remain committed to delivering strong cash generation with Adjusted Free Cash Flow conversion on Adjusted EBITDA of at least 60% by 2025. In addition, we remain focused on reducing annual dilution related to stock-based compensation and we continue to target average annual dilution from stock compensation expense of approximately 3% for 2025 and beyond.
Thank you for investing with us in this mission.
-The Axon team
Quarterly conference call and webcast
We will host our Q4 2023 earnings conference call webinar on Tuesday, February 27, at 2 p.m. PT / 5 p.m. ET.
The webcast will be available via a link on Axon’s investor relations website at https://investor.axon.com, or can be accessed directly via https://axon.zoom.us/j/94299685390.
Statistical Definitions
Annual recurring revenue: Annual recurring revenue is a performance indicator that management believes provides more visibility into the growth of our revenue generated by our highest margin, recurring services. Annual recurring revenue should be viewed independently of revenue and deferred revenue because it is an operating measure and is not intended to be combined with or to replace GAAP revenue or deferred revenue, as they can be impacted by contract start and end dates and renewal rates. Annual recurring revenue is not intended to be a replacement or forecast of revenue or deferred revenue. We calculate annual recurring revenue as monthly recurring license, integration, warranty, and storage revenue, annualized.
Net revenue retention: Dollar-based net revenue retention is an important metric to measure our ability to retain and expand our relationships with existing customers. We calculate it as the software and camera warranty subscription and support revenue from a base set of agency customers from which we generated Axon Cloud subscription revenue in the last month of a quarter divided by the software and camera warranty subscription and support revenue from the year-ago month of that same customer base. This calculation includes high-margin warranty revenue but purposely excludes the lower-margin hardware subscription component of the customer contracts, as it is meant to be a SaaS metric that we use to monitor the health of the recurring revenue business we are building. This calculation also excludes the implied monthly revenue contribution of customers that were added since the year-ago quarter, and therefore excludes the benefit of new customer acquisition. The metric includes customers, if any, that terminated during the annual period, and therefore, this metric is inclusive of customer churn. This metric is downwardly adjusted to account for the effect of phased deployments—meaning that, for the year-ago period, we consider the total contractually obligated implied monthly revenue amount, rather than monthly revenue amounts that might have been in actuality smaller on a GAAP basis due to the customer not having yet fully deployed their Axon solution. For more information relative to our revenue recognition policies, please reference our filings with the Securities and Exchange Commission (“SEC”).
Total company future contracted revenue: Total company future contracted revenue represents remaining performance obligation and includes both recognized contract liabilities as well as amounts that will be invoiced and recognized in future periods. The remaining performance obligations are limited only to arrangements that meet the definition of a contract under Accounting Standards Codification Topic 606 as of December 31, 2023. We currently expect to recognize between 15% to 25% of this balance over the next 12 months, and generally expect the remainder to be recognized over the following ten years, subject to risks related to delayed deployments, budget appropriation or other contract cancellation clauses.
Non-GAAP Measures
To supplement the Company’s financial results presented in accordance with GAAP, we present the non-GAAP financial measures of EBITDA, Adjusted EBITDA, Non-GAAP Net Income, Non-GAAP Diluted Earnings Per Share, Free Cash Flow, and Adjusted Free Cash Flow. The Company’s management uses these non-GAAP financial measures in evaluating the Company’s performance in comparison to prior periods. We believe that both management and investors benefit from referring to these non-GAAP financial measures in assessing its performance, and when planning and forecasting our future periods. A reconciliation of GAAP to the non-GAAP financial measures is presented below.
- EBITDA (Most comparable GAAP Measure: Net income) – Earnings before interest expense, investment interest income, income taxes, depreciation and amortization.
- Adjusted EBITDA (Most comparable GAAP Measure: Net income) – Earnings before interest expense, investment interest income, income taxes, depreciation, amortization, non-cash stock-based compensation expense, fair value adjustments to strategic investments and marketable securities, transaction costs related to acquisitions and investments, and other unusual, non-recurring pre-tax items that are not considered representative of our underlying operating performance (identified and listed below in the reconciliation).
- Adjusted EBITDA margin (Most comparable GAAP Measure: Net income margin) – Adjusted EBITDA as a percentage of net sales.
- Non-GAAP Net Income (Most comparable GAAP Measure: Net income) – Net income excluding the costs of non-cash stock-based compensation, gain/loss/write-down/disposal/abandonment of property, equipment and intangible assets; fair value adjustments to strategic investments and marketable securities; transaction costs related to acquisitions and investments; costs related to the Federal Trade Commission (“FTC”) litigation and antitrust litigation and other unusual, non-recurring pre-tax items that are not considered representative of our underlying operating performance (listed below). The Company tax-effects non-GAAP adjustments using the blended statutory federal and state tax rates for each period presented.
- Non-GAAP Diluted Earnings Per Share (Most comparable GAAP Measure: Earnings Per share) – Measure of Company’s Non-GAAP Net Income divided by the weighted average number of diluted common shares outstanding during the period presented.
- Free Cash Flow (Most comparable GAAP Measure: Cash flow from operating activities) – Cash flows provided by operating activities minus purchases of property and equipment and intangible assets.
- Adjusted Free Cash Flow (Most comparable GAAP Measure: Cash flow from operating activities) – Cash flows provided by operating activities minus purchases of property and equipment and intangible assets, excluding the net impact of investments in our new Scottsdale, Arizona campus and bond premium amortization.
- We believe that free cash flow and adjusted free cash flow excluding the impact of bond premium amortization and net campus investment are non-GAAP measures that are useful to investors and management to evaluate the Company’s ability to generate cash. These non-GAAP measures can also be used to evaluate the Company’s ability to generate cash flow from operations and the impact that this cash flow has on the Company’s liquidity.
Caution on Use of Non-GAAP Measures
Although these non-GAAP financial measures are not consistent with GAAP, management believes investors will benefit by referring to these non-GAAP financial measures when assessing the Company’s operating results, as well as when forecasting and analyzing future periods. However, management recognizes that:
- these non-GAAP financial measures are limited in their usefulness and should be considered only as a supplement to the Company’s GAAP financial measures;
- these non-GAAP financial measures should not be considered in isolation from, or as a substitute for, the Company’s GAAP financial measures;
- these non-GAAP financial measures should not be considered to be superior to the Company’s GAAP financial measures; and
- these non-GAAP financial measures were not prepared in accordance with GAAP or under a comprehensive set of rules or principles proposed by a third party.
- Further, these non-GAAP financial measures may be unique to the Company, as they may be different from similarly titled non-GAAP financial measures used by other companies. As such, this presentation of non-GAAP financial measures may not enhance the comparability of the Company’s results to the results of other companies.
About Axon
Axon is a technology leader in global public safety. Our moonshot goal is to cut gun-related deaths between police and the public by 50% before 2033. Axon is building the public safety operating system of the future by integrating a suite of hardware devices and cloud software solutions that lead modern policing. Axon’s suite includes TASER energy devices, body cameras, in-car cameras, cloud-hosted digital evidence management solutions, productivity software and real-time operations capabilities. Axon’s growing global customer base includes first responders across international, federal, state and local law enforcement, fire, corrections and emergency medical services, as well as the justice sector, enterprises and consumers.
Non-Axon trademarks are property of their respective owners.
Axon, Axon Air, Axon Body, Axon Auto-Transcribe, Axon Evidence, Axon Fleet, Axon Records, Axon Respond, Axon Standards, Axon VR, Sky-Hero, TASER, TASER 7, TASER 10, Protect Life, the Filled Bolt within Circle Logo and the Delta Logo are trademarks of Axon Enterprise, Inc., some of which are registered in the United States and other countries. For more information, visit www.axon.com/legal. All rights reserved.
Forward-looking statements
Forward-looking statements in this letter include, without limitation, statements regarding: proposed products and services and related development efforts and activities; expectations about the market for our current and future products and services, including statements related to our user base, customer profiles and TAM; the impact of pending litigation; strategies and trends relating to subscription plan programs and revenues; statements related to recently completed acquisitions; our anticipation that contracts with governmental customers will be fulfilled; the timing and realization of future contracted revenue; the fulfillment of bookings; strategies and trends, including the amounts and benefits of, R&D investments; the sufficiency of our liquidity and financial resources; expectations about customer behavior; statements concerning projections, predictions, expectations, estimates or forecasts as to our business, financial and operational results and future economic performance, including our outlook for 2024 full year revenue, stock-based compensation expense, Adjusted EBITDA, Adjusted EBITDA margin, and capital expenditures; statements of management’s strategies, goals and objectives and other similar expressions; as well as the ultimate resolution of financial statement items requiring critical accounting estimates, including those set forth in our Annual Report on Form 10‑K for the year ended December 31, 2022, and the soon-to-be-filed Form 10-K for the year ended December 31, 2023 (collectively, our “Annual Reports”). Such statements give our current expectations or forecasts of future events; they do not relate strictly to historical or current facts. Words such as “may,” “will,” “should,” “could,” “would,” “predict,” “potential,” “continue,” “expect,” “anticipate,” “future,” “intend,” “plan,” “believe,” “estimate,” and similar expressions, as well as statements in future tense, identify forward-looking statements. However, not all forward-looking statements contain these identifying words.
We cannot guarantee that any forward-looking statement will be realized, although we believe we have been prudent in our plans and assumptions. Achievement of future results is subject to risks, uncertainties and potentially inaccurate assumptions. The following important factors could cause actual results to differ materially from those in the forward-looking statements: our exposure to cancellations of government contracts due to appropriation clauses, exercise of a cancellation clause, or non-exercise of contractually optional periods; the ability of law enforcement agencies to obtain funding, including based on tax revenues; our ability to design, introduce and sell new products, services or features; our ability to defend against litigation and protect our intellectual property, and the resulting costs of this activity; our ability to win bids through the open bidding process for governmental agencies; our ability to manage our supply chain and avoid production delays, shortages and impacts to expected gross margins; the impacts of inflation, macroeconomic conditions and global events; the impact of catastrophic events or public health emergencies; the impact of stock-based compensation expense, impairment expense, and income tax expense on our financial results; customer purchase behavior, including adoption of our software as a service delivery model; negative media publicity or sentiment regarding our products; the impact of various factors on projected gross margins; defects in, or misuse of, our products; changes in the costs of product components and labor; loss of customer data, a breach of security, or an extended outage, including by our third party cloud-based storage providers; exposure to international operational risks; delayed cash collections and possible credit losses due to our subscription model; changes in government regulations in the United States and in foreign markets, especially related to the classification of our products by the United States Bureau of Alcohol, Tobacco, Firearms and Explosives; our ability to integrate acquired businesses; the impact of declines in the fair values or impairment of our investments, including our strategic investments; our ability to attract and retain key personnel; litigation or inquiries and related time and costs; and counter-party risks relating to cash balances held in excess of federally insured limits. Many events beyond our control may determine whether results we anticipate will be achieved. Should known or unknown risks or uncertainties materialize, or should underlying assumptions prove inaccurate, actual results could differ materially from past results and those anticipated, estimated or projected. You should bear this in mind as you consider forward-looking statements. The Annual Report on Form 10 K that we expect to file with the Securities and Exchange Commission (“SEC”) on February 27, 2024 lists various important factors that could cause actual results to differ materially from expected and historical results. These factors are intended as cautionary statements for investors within the meaning of Section 21E of the Securities Exchange Act of 1934, as amended, and Section 27A of the Securities Act of 1933, as amended. Readers can find them under the heading “Risk Factors” in our Annual Reports, and investors should refer to them. You should understand that it is not possible to predict or identify all such factors. You should understand that it is not possible to predict or identify all such factors. Consequently, you should not consider any such list to be a complete set of all potential risks or uncertainties.
Except as required by law, we undertake no obligation to publicly update forward-looking statements, whether as a result of new information, future events or otherwise. You are advised, however, to consult any further disclosures we make on related subjects in our Form 8-K, 10‑Q and 10‑K reports to the SEC. Our filings with the SEC may be accessed at the SEC’s web site at www.sec.gov.
Update on Legal Matters:
New Jersey Proposed Antitrust Class Action
Pending in the District of New Jersey (No. 3:23-cv-7182-RK-RLS) is a consolidated proposed class action lawsuit brought by the Township of Howell (NJ), the City of Augusta (ME), and the City of Baltimore (MD) alleging Axon’s 2018 acquisition of Vievu LLC from Safariland LLC was anticompetitive, and that certain non-compete provisions in an ancillary holster supply agreement between Axon and Safariland LLC unlawfully retrained trade. The complaint is based primarily on claims by the FTC regarding the transaction, that were dismissed without condition or consent decree in October 2023. Axon denies the allegations and will vigorously defend the action.
As previously reported, at the time of the acquisition, Vievu LLC was a significantly financially distressed company destined to exit the market, and we believe Axon’s action prevented major body-camera program disruptions for Vievu LLC customers. Plaintiffs Howell and Augusta have never purchased body-worn camera systems from Axon. Further, we believe Safariland LLC was never a TASER energy weapon competitor, had no intention of entering the energy weapon business, and has not done so in the four years since the parties rescinded the non-compete provisions of the holster agreement—provisions intended to protect Axon’s proprietary information and substantial intellectual property investments during new TASER product development.
On February 5, 2024, Axon served its motions to dismiss all claims and to strike the class allegations on numerous grounds, including that Axon’s federal, state, and municipal customers with sovereign immunity cannot be absent class members. Plaintiffs’ response is not due until mid-April with Axon’s reply due in mid-May. A decision is therefore unlikely before year end.
CONTACT:
Investor Relations
Axon Enterprise, Inc.
IR@axon.com
|
AXON ENTERPRISE, INC. CONSOLIDATED STATEMENTS OF OPERATIONS (in thousands, except per share data) |
|||||||||||||||
|
THREE MONTHS ENDED |
TWELVE MONTHS ENDED |
||||||||||||||
|
31 DEC 2023 |
30 SEP 2023 |
31 DEC 2022 |
31 DEC 2023 |
31 DEC 2022 |
|||||||||||
|
Net sales from products |
$ |
258,405 |
$ |
256,443 |
$ |
214,735 |
$ |
967,711 |
$ |
801,388 |
|||||
|
Net sales from services |
173,737 |
157,158 |
121,407 |
595,680 |
388,547 |
||||||||||
|
Net sales |
432,142 |
413,601 |
336,142 |
1,563,391 |
1,189,935 |
||||||||||
|
Cost of product sales |
125,664 |
116,278 |
102,641 |
450,718 |
363,219 |
||||||||||
|
Cost of service sales |
42,591 |
42,051 |
27,822 |
157,291 |
98,078 |
||||||||||
|
Cost of sales |
168,255 |
158,329 |
130,463 |
608,009 |
461,297 |
||||||||||
|
Gross margin |
263,887 |
255,272 |
205,679 |
955,382 |
728,638 |
||||||||||
|
Operating expenses: |
|||||||||||||||
|
Sales, general and administrative |
137,106 |
123,279 |
114,418 |
496,874 |
401,575 |
||||||||||
|
Research and development |
83,972 |
76,880 |
68,720 |
303,719 |
233,810 |
||||||||||
|
Total operating expenses |
221,078 |
200,159 |
183,138 |
800,593 |
635,385 |
||||||||||
|
Income from operations |
42,809 |
55,113 |
22,541 |
154,789 |
93,253 |
||||||||||
|
Interest Income, net |
12,325 |
10,458 |
4,140 |
42,112 |
4,294 |
||||||||||
|
Other income (loss), net |
668 |
3,852 |
8,049 |
(41,901) |
98,971 |
||||||||||
|
Income before provision for income taxes |
55,802 |
69,423 |
34,730 |
155,000 |
196,518 |
||||||||||
|
Provision for (benefit from) income taxes |
(1,469) |
10,026 |
5,555 |
(19,227) |
49,379 |
||||||||||
|
Net income |
$ |
57,271 |
$ |
59,397 |
$ |
29,175 |
$ |
174,227 |
$ |
147,139 |
|||||
|
Net income per common and common equivalent shares: |
|||||||||||||||
|
Basic |
$ |
0.76 |
$ |
0.79 |
$ |
0.41 |
$ |
2.35 |
$ |
2.07 |
|||||
|
Diluted |
$ |
0.75 |
$ |
0.78 |
$ |
0.40 |
$ |
2.31 |
$ |
2.03 |
|||||
|
Weighted average number of common and common equivalent shares outstanding: |
|||||||||||||||
|
Basic |
75,060 |
74,826 |
71,270 |
74,195 |
71,093 |
||||||||||
|
Diluted |
76,178 |
75,952 |
72,976 |
75,456 |
72,534 |
||||||||||
|
AXON ENTERPRISE, INC. SEGMENT REPORTING (in thousands) |
||||||||||||||||||||||||||||||||||||
|
THREE MONTHS ENDED |
THREE MONTHS ENDED |
THREE MONTHS ENDED |
||||||||||||||||||||||||||||||||||
|
31 DEC 2023 |
30 SEP 2023 |
31 DEC 2022 |
||||||||||||||||||||||||||||||||||
|
Software |
Software |
Software |
||||||||||||||||||||||||||||||||||
|
and |
and |
and |
||||||||||||||||||||||||||||||||||
|
TASER |
Sensors |
Total |
TASER |
Sensors |
Total |
TASER |
Sensors |
Total |
||||||||||||||||||||||||||||
|
Net sales from products (1) |
$ |
151,238 |
$ |
107,167 |
$ |
258,405 |
$ |
153,375 |
$ |
103,068 |
$ |
256,443 |
$ |
128,868 |
$ |
85,867 |
$ |
214,735 |
||||||||||||||||||
|
Net sales from services (2) |
10,105 |
163,632 |
173,737 |
9,195 |
147,963 |
157,158 |
7,869 |
113,538 |
121,407 |
|||||||||||||||||||||||||||
|
Net sales |
161,343 |
270,799 |
432,142 |
162,570 |
251,031 |
413,601 |
136,737 |
199,405 |
336,142 |
|||||||||||||||||||||||||||
|
Cost of product sales |
68,067 |
57,597 |
125,664 |
59,746 |
56,532 |
116,278 |
52,447 |
50,194 |
102,641 |
|||||||||||||||||||||||||||
|
Cost of service sales |
1,096 |
41,495 |
42,591 |
1,252 |
40,799 |
42,051 |
— |
27,822 |
27,822 |
|||||||||||||||||||||||||||
|
Cost of sales |
69,163 |
99,092 |
168,255 |
60,998 |
97,331 |
158,329 |
52,447 |
78,016 |
130,463 |
|||||||||||||||||||||||||||
|
Gross margin |
92,180 |
171,707 |
263,887 |
101,572 |
153,700 |
255,272 |
84,290 |
121,389 |
205,679 |
|||||||||||||||||||||||||||
|
Gross margin % |
57.1 |
% |
63.4 |
% |
61.1 |
% |
62.5 |
% |
61.2 |
% |
61.7 |
% |
61.6 |
% |
60.9 |
% |
61.2 |
% |
||||||||||||||||||
|
Research and development |
16,265 |
67,707 |
83,972 |
15,672 |
61,208 |
76,880 |
14,531 |
54,189 |
68,720 |
|||||||||||||||||||||||||||
|
TWELVE MONTHS ENDED |
TWELVE MONTHS ENDED |
|||||||||||||||||||||||
|
31 DEC 2023 |
31 DEC 2022 |
|||||||||||||||||||||||
|
Software |
Software |
|||||||||||||||||||||||
|
and |
and |
|||||||||||||||||||||||
|
TASER |
Sensors |
Total |
TASER |
Sensors |
Total |
|||||||||||||||||||
|
Net sales from products (1) |
$ |
577,610 |
$ |
390,101 |
$ |
967,711 |
$ |
511,010 |
$ |
290,378 |
$ |
801,388 |
||||||||||||
|
Net sales from services (2) |
34,995 |
560,685 |
595,680 |
20,556 |
367,991 |
388,547 |
||||||||||||||||||
|
Net sales |
612,605 |
950,786 |
1,563,391 |
531,566 |
658,369 |
1,189,935 |
||||||||||||||||||
|
Cost of product sales |
238,364 |
212,354 |
450,718 |
194,957 |
168,262 |
363,219 |
||||||||||||||||||
|
Cost of service sales |
3,613 |
153,678 |
157,291 |
— |
98,078 |
98,078 |
||||||||||||||||||
|
Cost of sales |
241,977 |
366,032 |
608,009 |
194,957 |
266,340 |
461,297 |
||||||||||||||||||
|
Gross margin |
370,628 |
584,754 |
955,382 |
336,609 |
392,029 |
728,638 |
||||||||||||||||||
|
Gross margin % |
60.5 |
% |
61.5 |
% |
61.1 |
% |
63.3 |
% |
59.5 |
% |
61.2 |
% |
||||||||||||
|
Research and development |
62,393 |
241,326 |
303,719 |
51,607 |
182,203 |
233,810 |
||||||||||||||||||
|
(1) |
Software and Sensors “products” revenue consists of sensors, including on-officer body cameras, Axon Fleet cameras, other hardware sensors, warranties on sensors, and other products, and is sometimes referred to as Sensors and Other revenue. |
||||||
|
(2) |
Software and Sensors “services” revenue comprises sales related to the Axon Cloud and Services, which includes Axon Evidence, cloud-based evidence management software revenue, other recurring cloud-hosted software revenue and related professional services, and is sometimes referred to as Axon Cloud and Services revenue. |
||||||
Note: The level of integration across Axon’s business, including our TASER and Software & Sensors segments, with highly complementary products sold under subscription plans to our customers means that much of our SG&A expenses support both segments, together. This is increasingly true for our R&D expenses, as well, with our Chief Product Officer and Chief Technology Officer overseeing all R&D spend. Thus, starting with our Q1 2024 disclosures, we will no longer break out R&D by segment, similar to our combined SG&A reporting, but we will continue to provide revenue and gross margin by segment.
|
AXON ENTERPRISE, INC. SALES BY PRODUCT AND SERVICE (in thousands) |
|||||||||||||||||
|
THREE MONTHS ENDED |
|||||||||||||||||
|
31 DEC 2023 |
30 SEP 2023 |
31 DEC 2022 |
|||||||||||||||
|
TASER segment: |
|||||||||||||||||
|
TASER Devices (Professional) |
$ |
94,758 |
21.9 |
% |
$ |
86,718 |
21.0 |
% |
$ |
69,075 |
20.5 |
% |
|||||
|
Cartridges |
43,781 |
10.1 |
54,279 |
13.1 |
47,541 |
14.1 |
|||||||||||
|
Axon Evidence and Cloud Services |
10,105 |
2.4 |
8,975 |
2.2 |
6,890 |
2.0 |
|||||||||||
|
Extended Warranties |
8,226 |
1.9 |
8,078 |
1.9 |
7,580 |
2.3 |
|||||||||||
|
Other (1) |
4,473 |
1.0 |
4,520 |
1.1 |
5,651 |
1.7 |
|||||||||||
|
Total TASER segment |
161,343 |
37.3 |
162,570 |
39.3 |
136,737 |
40.6 |
|||||||||||
|
Software and Sensors segment: |
|||||||||||||||||
|
Axon Body Cameras and Accessories |
58,957 |
13.7 |
52,488 |
12.7 |
43,882 |
13.1 |
|||||||||||
|
Axon Fleet Systems |
22,481 |
5.2 |
26,716 |
6.4 |
23,177 |
6.9 |
|||||||||||
|
Axon Evidence and Cloud Services |
165,204 |
38.2 |
150,563 |
36.4 |
113,225 |
33.7 |
|||||||||||
|
Extended Warranties |
17,272 |
4.0 |
16,054 |
3.9 |
13,695 |
4.1 |
|||||||||||
|
Other (2) |
6,885 |
1.6 |
5,210 |
1.3 |
5,426 |
1.6 |
|||||||||||
|
Total Software and Sensors segment |
270,799 |
62.7 |
251,031 |
60.7 |
199,405 |
59.4 |
|||||||||||
|
Total net sales |
$ |
432,142 |
100.0 |
% |
$ |
413,601 |
100.0 |
% |
$ |
336,142 |
100.0 |
% |
|||||
|
TWELVE MONTHS ENDED |
|||||||||||
|
31 DEC 2023 |
31 DEC 2022 |
||||||||||
|
TASER segment: |
|||||||||||
|
TASER Devices (Professional) |
$ |
333,923 |
21.4 |
% |
$ |
282,698 |
23.8 |
% |
|||
|
Cartridges |
193,285 |
12.4 |
181,686 |
15.3 |
|||||||
|
Axon Evidence and Cloud Services |
34,775 |
2.2 |
18,752 |
1.6 |
|||||||
|
Extended Warranties |
31,689 |
2.0 |
29,008 |
2.4 |
|||||||
|
Other (1) |
18,933 |
1.2 |
19,422 |
1.6 |
|||||||
|
Total TASER segment |
612,605 |
39.2 |
531,566 |
44.7 |
|||||||
|
Software and Sensors segment: |
|||||||||||
|
Axon Body Cameras and Accessories |
183,023 |
11.7 |
157,281 |
13.2 |
|||||||
|
Axon Fleet Systems |
118,129 |
7.6 |
63,017 |
5.3 |
|||||||
|
Axon Evidence and Cloud Services |
566,183 |
36.2 |
371,889 |
31.3 |
|||||||
|
Extended Warranties |
62,577 |
4.0 |
49,765 |
4.1 |
|||||||
|
Other (2) |
20,874 |
1.3 |
16,417 |
1.4 |
|||||||
|
Total Software and Sensors segment |
950,786 |
60.8 |
658,369 |
55.3 |
|||||||
|
Total net sales |
$ |
1,563,391 |
100.0 |
% |
$ |
1,189,935 |
100.0 |
% |
|||
|
(1) |
TASER segment “Other” includes smaller categories, such as VR hardware, weapons training revenue such as revenue associated with our Master Instructor School, and TASER consumer device sales. |
||||||
|
(2) |
Software and Sensors segment “Other” includes revenue from items including Signal Sidearm, Interview Room and Axon Air. |
||||||
|
AXON ENTERPRISE, INC. RECONCILIATION OF GAAP TO NON-GAAP FINANCIAL MEASURES (in thousands) |
||||||||||||||||
|
THREE MONTHS ENDED |
TWELVE MONTHS ENDED |
|||||||||||||||
|
31 DEC 2023 |
30 SEP 2023 |
31 DEC 2022 |
31 DEC 2023 |
31 DEC 2022 |
||||||||||||
|
EBITDA and Adjusted EBITDA: |
||||||||||||||||
|
Net income |
$ |
57,271 |
$ |
59,397 |
$ |
29,175 |
$ |
174,227 |
$ |
147,139 |
||||||
|
Depreciation and amortization |
10,051 |
8,418 |
6,210 |
32,638 |
24,381 |
|||||||||||
|
Interest expense |
1,772 |
1,762 |
474 |
6,995 |
488 |
|||||||||||
|
Investment interest income |
(14,097) |
(12,220) |
(4,614) |
(49,107) |
(4,782) |
|||||||||||
|
Provision for (benefit from) income taxes |
(1,469) |
10,026 |
5,555 |
(19,227) |
49,379 |
|||||||||||
|
EBITDA |
$ |
53,528 |
$ |
67,383 |
$ |
36,800 |
$ |
145,526 |
$ |
216,605 |
||||||
|
Adjustments: |
||||||||||||||||
|
Stock-based compensation expense |
$ |
35,130 |
$ |
29,987 |
$ |
31,722 |
$ |
131,358 |
$ |
106,176 |
||||||
|
Unrealized loss (gain) on strategic investments and marketable securities, net |
(521) |
(4,036) |
(6,445) |
41,785 |
(98,943) |
|||||||||||
|
Transaction costs related to strategic investments and acquisitions |
2,708 |
495 |
64 |
4,501 |
2,368 |
|||||||||||
|
Loss on disposal, abandonment, and impairment of property, equipment and intangible assets, net |
— |
137 |
3,530 |
317 |
5,562 |
|||||||||||
|
Insurance recoveries |
— |
(2,615) |
— |
(3,404) |
— |
|||||||||||
|
Costs related to FTC litigation and antitrust litigation |
169 |
71 |
250 |
241 |
545 |
|||||||||||
|
Payroll taxes related to 2019 XSPP vesting and 2018 CEO Performance Award option exercises |
50 |
201 |
— |
9,011 |
— |
|||||||||||
|
Adjusted EBITDA |
$ |
91,064 |
$ |
91,623 |
$ |
65,921 |
$ |
329,335 |
$ |
232,313 |
||||||
|
Net income as a percentage of net sales |
13.3 |
% |
14.4 |
% |
8.7 |
% |
11.1 |
% |
12.4 |
% |
||||||
|
Adjusted EBITDA as a percentage of net sales |
21.1 |
% |
22.2 |
% |
19.6 |
% |
21.1 |
% |
19.5 |
% |
||||||
|
Stock-based compensation expense: |
||||||||||||||||
|
Cost of product and service sales |
$ |
1,910 |
$ |
1,687 |
$ |
1,276 |
$ |
6,595 |
$ |
4,607 |
||||||
|
Sales, general and administrative |
15,301 |
12,886 |
15,441 |
58,533 |
51,301 |
|||||||||||
|
Research and development |
17,919 |
15,414 |
15,005 |
66,230 |
50,268 |
|||||||||||
|
Total |
$ |
35,130 |
$ |
29,987 |
$ |
31,722 |
$ |
131,358 |
$ |
106,176 |
||||||
|
AXON ENTERPRISE, INC. RECONCILIATION OF GAAP TO NON-GAAP FINANCIAL MEASURES – continued (in thousands, except per share amounts) |
||||||||||||||||
|
THREE MONTHS ENDED |
TWELVE MONTHS ENDED |
|||||||||||||||
|
31 DEC 2023 |
30 SEP 2023 |
31 DEC 2022 |
31 DEC 2023 |
31 DEC 2022 |
||||||||||||
|
Non-GAAP net income: |
||||||||||||||||
|
GAAP net income |
$ |
57,271 |
$ |
59,397 |
$ |
29,175 |
$ |
174,227 |
$ |
147,139 |
||||||
|
Non-GAAP adjustments: |
||||||||||||||||
|
Stock-based compensation expense |
35,130 |
29,987 |
31,722 |
131,358 |
106,176 |
|||||||||||
|
Unrealized loss (gain) on strategic investments and marketable securities, net |
(521) |
(4,036) |
(6,445) |
41,785 |
(98,943) |
|||||||||||
|
Transaction costs related to strategic investments and acquisitions |
2,708 |
495 |
64 |
4,501 |
2,368 |
|||||||||||
|
Loss on disposal, abandonment, and impairment of property, equipment and intangible assets, net |
— |
137 |
3,530 |
317 |
5,562 |
|||||||||||
|
Insurance recoveries |
— |
(2,615) |
— |
(3,404) |
— |
|||||||||||
|
Costs related to FTC litigation and antitrust litigation |
169 |
71 |
250 |
241 |
545 |
|||||||||||
|
Payroll taxes related to 2019 XSPP vesting and 2018 CEO Performance Award option exercises |
50 |
201 |
— |
9,011 |
— |
|||||||||||
|
Income tax effects |
(9,391) |
(6,168) |
(7,276) |
(46,015) |
(3,936) |
|||||||||||
|
Non-GAAP net income |
$ |
85,416 |
$ |
77,469 |
$ |
51,020 |
$ |
312,021 |
$ |
158,911 |
||||||
|
Diluted income per common share |
||||||||||||||||
|
GAAP |
$ |
0.75 |
$ |
0.78 |
$ |
0.40 |
$ |
2.31 |
$ |
2.03 |
||||||
|
Non-GAAP |
$ |
1.12 |
$ |
1.02 |
$ |
0.70 |
$ |
4.14 |
$ |
2.19 |
||||||
|
Weighted average number of diluted common and common equivalent shares outstanding (in thousands) |
76,178 |
75,952 |
72,976 |
75,456 |
72,534 |
|||||||||||
|
AXON ENTERPRISE, INC. CONSOLIDATED BALANCE SHEETS (in thousands) |
||||||
|
31 DEC 2023 |
31 DEC 2022 |
|||||
|
ASSETS |
||||||
|
Current Assets: |
||||||
|
Cash and cash equivalents |
$ |
598,545 |
$ |
353,684 |
||
|
Marketable securities |
77,940 |
39,240 |
||||
|
Short-term investments |
644,054 |
581,769 |
||||
|
Accounts and notes receivable, net |
417,690 |
358,190 |
||||
|
Contract assets, net |
275,779 |
196,902 |
||||
|
Inventory |
269,855 |
202,471 |
||||
|
Prepaid expenses and other current assets |
112,786 |
73,022 |
||||
|
Total current assets |
2,396,649 |
1,805,278 |
||||
|
Property and equipment, net |
200,533 |
169,843 |
||||
|
Deferred tax assets, net |
229,513 |
156,866 |
||||
|
Intangible assets, net |
19,539 |
12,158 |
||||
|
Goodwill |
57,945 |
44,983 |
||||
|
Long-term investments |
— |
156,207 |
||||
|
Long-term notes receivable, net |
2,588 |
5,210 |
||||
|
Long-term contract assets, net |
77,710 |
45,170 |
||||
|
Strategic investments |
231,730 |
296,563 |
||||
|
Other long-term assets |
220,638 |
159,616 |
||||
|
Total assets |
$ |
3,436,845 |
$ |
2,851,894 |
||
|
LIABILITIES AND STOCKHOLDERS’ EQUITY |
||||||
|
Current Liabilities: |
||||||
|
Accounts payable |
88,326 |
59,918 |
||||
|
Accrued liabilities |
188,230 |
155,934 |
||||
|
Current portion of deferred revenue |
491,691 |
360,037 |
||||
|
Customer deposits |
21,935 |
20,399 |
||||
|
Other current liabilities |
9,787 |
6,358 |
||||
|
Total current liabilities |
799,969 |
602,646 |
||||
|
Deferred revenue, net of current portion |
281,852 |
248,003 |
||||
|
Liability for unrecognized tax benefits |
18,049 |
10,745 |
||||
|
Long-term deferred compensation |
11,342 |
6,285 |
||||
|
Deferred tax liability, net |
— |
1 |
||||
|
Long-term lease liabilities |
33,550 |
37,143 |
||||
|
Convertible notes, net |
677,113 |
673,967 |
||||
|
Other long-term liabilities |
2,936 |
4,613 |
||||
|
Total liabilities |
1,824,811 |
1,583,403 |
||||
|
Stockholders’ Equity: |
||||||
|
Preferred stock |
— |
— |
||||
|
Common stock |
1 |
1 |
||||
|
Additional paid-in capital |
1,347,410 |
1,174,594 |
||||
|
Treasury stock |
(155,947) |
(155,947) |
||||
|
Retained earnings |
431,249 |
257,022 |
||||
|
Accumulated other comprehensive loss |
(10,679) |
(7,179) |
||||
|
Total stockholders’ equity |
1,612,034 |
1,268,491 |
||||
|
Total liabilities and stockholders’ equity |
$ |
3,436,845 |
$ |
2,851,894 |
||
|
AXON ENTERPRISE, INC. CONDENSED CONSOLIDATED STATEMENTS OF CASH FLOWS (in thousands) |
||||||||||||||||
|
THREE MONTHS ENDED |
TWELVE MONTHS ENDED |
|||||||||||||||
|
31 DEC 2023 |
30 SEP 2023 |
31 DEC 2022 |
31 DEC 2023 |
31 DEC 2022 |
||||||||||||
|
Cash flows from operating activities: |
||||||||||||||||
|
Net income |
$ |
57,271 |
$ |
59,397 |
$ |
29,175 |
$ |
174,227 |
$ |
147,139 |
||||||
|
Adjustments to reconcile net income to net cash provided by operating activities: |
||||||||||||||||
|
Stock-based compensation |
35,130 |
29,987 |
31,722 |
131,358 |
106,176 |
|||||||||||
|
Deferred income taxes |
(19,691) |
(15,706) |
(8,259) |
(73,002) |
22,090 |
|||||||||||
|
Unrealized (gain) loss on strategic investments and marketable securities, net |
(521) |
(4,036) |
(6,445) |
41,785 |
(98,943) |
|||||||||||
|
Depreciation and amortization |
10,051 |
8,418 |
6,210 |
32,638 |
24,381 |
|||||||||||
|
Bond amortization |
(4,378) |
(4,035) |
(1,402) |
(16,449) |
(1,463) |
|||||||||||
|
Noncash lease expense |
1,956 |
1,912 |
1,728 |
6,846 |
6,725 |
|||||||||||
|
Amortization of debt issuance cost |
798 |
797 |
198 |
3,126 |
198 |
|||||||||||
|
Unrecognized tax benefits |
473 |
1,435 |
(44) |
4,775 |
3,475 |
|||||||||||
|
Other noncash items |
2,389 |
(1,524) |
3,871 |
2,322 |
6,530 |
|||||||||||
|
Change in assets and liabilities: |
. |
|||||||||||||||
|
Accounts and notes receivable and contract assets |
9,944 |
(80,263) |
41,818 |
(172,524) |
(73,228) |
|||||||||||
|
Inventory |
(12,332) |
(15,979) |
(29,720) |
(71,896) |
(95,987) |
|||||||||||
|
Prepaid expenses and other assets |
(37,762) |
(15,318) |
(34,336) |
(102,370) |
(52,207) |
|||||||||||
|
Accounts payable, accrued and other liabilities |
50,961 |
49,399 |
52,073 |
64,384 |
80,757 |
|||||||||||
|
Deferred revenue |
45,749 |
48,408 |
44,531 |
164,043 |
159,718 |
|||||||||||
|
Net cash provided by operating activities |
140,038 |
62,892 |
131,120 |
189,263 |
235,361 |
|||||||||||
|
Cash flows from investing activities: |
||||||||||||||||
|
Purchases of investments |
(118,995) |
(180,944) |
(570,232) |
(545,988) |
(764,374) |
|||||||||||
|
Proceeds from call / maturity of investments |
196,204 |
80,132 |
56,653 |
657,418 |
72,138 |
|||||||||||
|
Purchases of property, plant and equipment |
(24,011) |
(13,974) |
(11,584) |
(59,635) |
(55,802) |
|||||||||||
|
Proceeds from disposal of property and equipment |
31 |
64 |
61 |
98 |
287 |
|||||||||||
|
Purchase of intangible assets |
(56) |
(392) |
(114) |
(635) |
(307) |
|||||||||||
|
Strategic investments |
— |
(6,775) |
(3,750) |
(17,692) |
(80,805) |
|||||||||||
|
Business acquisition, net of cash acquired |
— |
(64) |
— |
(21,090) |
(2,104) |
|||||||||||
|
Net cash provided by (used in) investing activities |
53,173 |
(121,953) |
(528,966) |
12,476 |
(830,967) |
|||||||||||
|
Cash flows from financing activities: |
||||||||||||||||
|
Net proceeds from equity offering |
— |
(101) |
— |
94,705 |
(74) |
|||||||||||
|
Proceeds from options exercised |
— |
— |
— |
54,503 |
— |
|||||||||||
|
Income and payroll tax payments for net-settled stock awards |
(3,818) |
(7,021) |
(2,479) |
(107,894) |
(4,870) |
|||||||||||
|
Net proceeds from issuance of convertible senior notes |
— |
— |
673,769 |
— |
673,769 |
|||||||||||
|
Proceeds from issuance of warrants |
— |
— |
124,269 |
— |
124,269 |
|||||||||||
|
Purchase of convertible note hedge |
— |
— |
(194,994) |
— |
(194,994) |
|||||||||||
|
Net cash provided by (used in) financing activities |
(3,818) |
(7,122) |
600,565 |
41,314 |
598,100 |
|||||||||||
|
Effect of exchange rate changes on cash and cash equivalents |
3,266 |
(2,007) |
3,403 |
2,065 |
(3,380) |
|||||||||||
|
Net increase (decrease) in cash and cash equivalents and restricted cash |
192,659 |
(68,190) |
206,122 |
245,118 |
(886) |
|||||||||||
|
Cash and cash equivalents and restricted cash, beginning of period |
408,011 |
476,201 |
149,430 |
355,552 |
356,438 |
|||||||||||
|
Cash and cash equivalents and restricted cash, end of period |
$ |
600,670 |
$ |
408,011 |
$ |
355,552 |
$ |
600,670 |
$ |
355,552 |
||||||
|
AXON ENTERPRISE, INC. SELECTED CASH FLOW INFORMATION (in thousands) |
|||||||||||||||
|
THREE MONTHS ENDED |
TWELVE MONTHS ENDED |
||||||||||||||
|
31 DEC 2023 |
30 SEP 2023 |
31 DEC 2022 |
31 DEC 2023 |
31 DEC 2022 |
|||||||||||
|
Net cash provided by operating activities |
$ |
140,038 |
$ |
62,892 |
$ |
131,120 |
$ |
189,263 |
$ |
235,361 |
|||||
|
Purchases of property, plant and equipment |
(24,011) |
(13,974) |
(11,584) |
(59,635) |
(55,802) |
||||||||||
|
Purchase of intangible assets |
(56) |
(392) |
(114) |
(635) |
(307) |
||||||||||
|
Free cash flow, a non-GAAP measure |
$ |
115,971 |
$ |
48,526 |
$ |
119,422 |
$ |
128,993 |
$ |
179,252 |
|||||
|
Bond premium amortization |
4,378 |
4,035 |
1,402 |
16,449 |
1,463 |
||||||||||
|
Net campus investment |
606 |
761 |
2,724 |
2,669 |
15,899 |
||||||||||
|
Adjusted free cash flow, a non-GAAP measure |
$ |
120,955 |
$ |
53,322 |
$ |
123,548 |
$ |
148,111 |
$ |
196,614 |
|||||
|
AXON ENTERPRISE, INC. SUPPLEMENTAL TABLES (in thousands) |
||||||
|
31 DEC 2023 |
31 DEC 2022 |
|||||
|
(Unaudited) |
||||||
|
Cash and cash equivalents |
$ |
598,545 |
$ |
353,684 |
||
|
Short-term investments |
644,054 |
581,769 |
||||
|
Long-term investments |
— |
156,207 |
||||
|
Cash and cash equivalents and investments, net |
1,242,599 |
1,091,660 |
||||
|
Convertible notes, principal amount |
(690,000) |
(690,000) |
||||
|
Total cash and cash equivalents and investments, net of convertible notes |
$ |
552,599 |
$ |
401,660 |
||
![]()
![]() View original content to download multimedia:https://www.prnewswire.com/news-releases/axon-2023-revenue-grows-31-to-1-56-billion-302073272.html
View original content to download multimedia:https://www.prnewswire.com/news-releases/axon-2023-revenue-grows-31-to-1-56-billion-302073272.html
SOURCE Axon
